

Track eight numbers first: several key performance indicators including revenue per technician, average repair order, first-time fix rate, billable-hour ratio, service agreement attach rate, agreement renewal rate, callback rate, and gross margin by job. Together they tell you whether your shop is making money, keeping customers, and using its trucks well. Check dispatch-level numbers daily, revenue mix weekly, and margins and renewals monthly.
TL;DR:
- HVAC shops should focus on revenue per technician and first-time fix rate to directly impact profitability and identify inventory or training gaps.
- Tracking callback rate and billable-hour ratio helps uncover operational inefficiencies and routing issues that erode margins.
- Service agreement attach rate and renewal rate serve as leading indicators of customer retention and recurring revenue growth.
- Weekly review of KPIs like ticket size and booking rates ensures timely intervention to prevent cash flow issues and margin erosion.
- Using automated platforms to monitor these KPIs in real-time improves responsiveness and prevents performance decline.
Table of Contents
- What Are the Most Important HVAC KPIs to Track First?
- How Do You Read Revenue and Profitability KPIs?
- Which Field KPIs Signal Operational Trouble?
- Which Customer KPIs Predict Retention and Referrals?
- What Cadence Should You Use to Review HVAC KPIs?
- How Do You Turn a Falling KPI Into a Fixed One?
- How Signal Engine Applies These KPIs in Practice
- Why a Short Scorecard Beats a Long KPI List
- Ready to Stop the Revenue Leak?
- Sources
- FAQ
What Are the Most Important HVAC KPIs to Track First?
Each of these HVAC KPIs answers a different question about your business, and each comes with a lever you can pull the same week you spot a problem.
- Revenue per technician: total revenue divided by tech headcount, benchmarked around $250,000 to $325,000 annually for residential operators. Below that range, look at close rates and schedule density before you look at pricing.
- Average repair order (ARO): typically $475 to $700 for blended residential work. A low ARO usually means techs aren't presenting options, not that customers won't pay.
- First-time fix rate (FTFR): jobs closed on the first visit. 70 to 80% is typical, 80%+ is excellent. Weak FTFR points straight at truck stock.
- Billable-hour ratio: paid hours against clocked hours. Routing software and tighter drive-time windows move this fast.
- Service agreement attach rate: new agreements sold per completed job, 15 to 30% typical, 30 to 50% strong.
- Agreement renewal rate: the recurring revenue anchor; weak renewals mean a service quality issue, not a pricing one.
- Callback rate: repeat visits for the same problem, a direct drain on margin.
- Gross margin by job: revenue minus labor and parts cost per ticket, the cleanest read on whether you're pricing work correctly.
How Do You Read Revenue and Profitability KPIs?
Revenue KPIs tell you where the money comes from and whether your crew is producing at capacity. ARO measures the average dollar value per completed repair ticket. A shop sitting well under $475 is often under-selling maintenance add-ons or skipping a proper diagnostic fee.
Revenue per technician is the single most diagnostic figure in the business, because it bundles job count, ticket size, and close rate into one number. A tech running $200,000 a year against a $300,000 peer isn't necessarily slower. Something in their booking rate, upsell conversation, or route density is off.
Benchmark check: Top-quartile HVAC operators pair a booking rate above 50% with net profit margins in the 10 to 20% range. If your margin sits below that band, check install-versus-service mix first. Too much low-margin install work without matching service revenue starves cash flow even when top-line sales look healthy.
- Track install-to-service revenue ratio monthly to catch cash crunches early.
- Calculate gross margin separately for install, service, and maintenance departments.
- Compare operating cost ratio against revenue growth to spot margin erosion before it hits the P&L.
Which Field KPIs Signal Operational Trouble?
First-time fix rate is the number that exposes training and inventory gaps fastest, but only when you break it down by technician instead of reading a shop-wide average.
Billable-hour ratio divides paid labor hours by total clocked hours. A tech clocked eight hours but billing five has three hours lost to drive time, paperwork, or poor routing. Callback rate carries a hidden cost most owners underprice: every callback burns a truck roll, parts, and labor that never generates revenue, and it quietly erodes the trust that drives referrals.
- Calculate FTFR per technician weekly, not just as a company-wide monthly average.
- Audit parts-on-truck completion against your top 20 most-replaced components.
- Flag any tech with a callback rate above 10% for a ride-along review.
Pro Tip: Pull your callback data by failure type, not just by technician. If half your callbacks trace back to one part number, you have an inventory problem wearing a training disguise.
Which Customer KPIs Predict Retention and Referrals?
Service agreement attach rate and renewal rate together tell you whether your recurring revenue base is growing or leaking. Attach rate above 30% means your techs are asking every customer, not just the ones who bring it up first.
NPS or a simple CSAT score after every job works as an early warning system. A dip shows up in survey scores months before it shows up in a renewal number, giving you time to fix a service issue before it costs you the account.
- Track attach rate as a percentage of completed service calls, reviewed monthly.
- Set a renewal target and flag any tech or route falling more than 10 points below it.
- Monitor review velocity (new reviews per week), since steady flow drives more organic bookings than a single high rating.
What Cadence Should You Use to Review HVAC KPIs?
Different HVAC performance metrics need different review windows, and mismatching cadence to metric is one of the most common reasons KPI programs stall out. Dispatch-level numbers move too fast for a monthly report to catch; margin numbers need a full month of data to mean anything.
- Daily: dispatched calls, revenue per truck, and a same-day FTFR snapshot reviewed in a short morning huddle.
- Weekly: average ticket, booking and close rate, and net new maintenance plan adds.
- Monthly: department-level P&L, gross margin by job, accounts receivable days outstanding, and customer acquisition cost.
- Quarterly: net revenue retention, customer lifetime value, and any rebate or warranty exposure worth a strategic look.
A platform mix review at the same cadence helps you see which booking channels are actually converting, not just generating calls.
How Do You Turn a Falling KPI Into a Fixed One?
Spotting a weak number is only step one. The real leverage is in the next 7 to 90 days, and the order you fix things in.
- First 7 days: audit parts-on-truck against your top failure codes and run a daily huddle checklist that flags any job at risk of a second visit before the tech leaves the driveway.
- Next 30 days: rebuild your repair ticket menu with clear good/better/best options and coach technicians on presenting all three, not just the fix.
- Next 90 days: rework your chart of accounts so margin reports by department instead of blended, and evaluate routing software if drive time is eating your billable-hour ratio.
- Prioritize by constraint: fix whichever KPI is costing you the most revenue first. A callback problem eating 15% of technician hours outranks a renewal rate that's merely below target.
Pro Tip: Don't tackle all eight KPIs at once. Pick the one costing the most cash today, fix it for 30 days, then move to the next. A compact, well-owned KPI set beats a long list nobody checks.
How Signal Engine Applies These KPIs in Practice
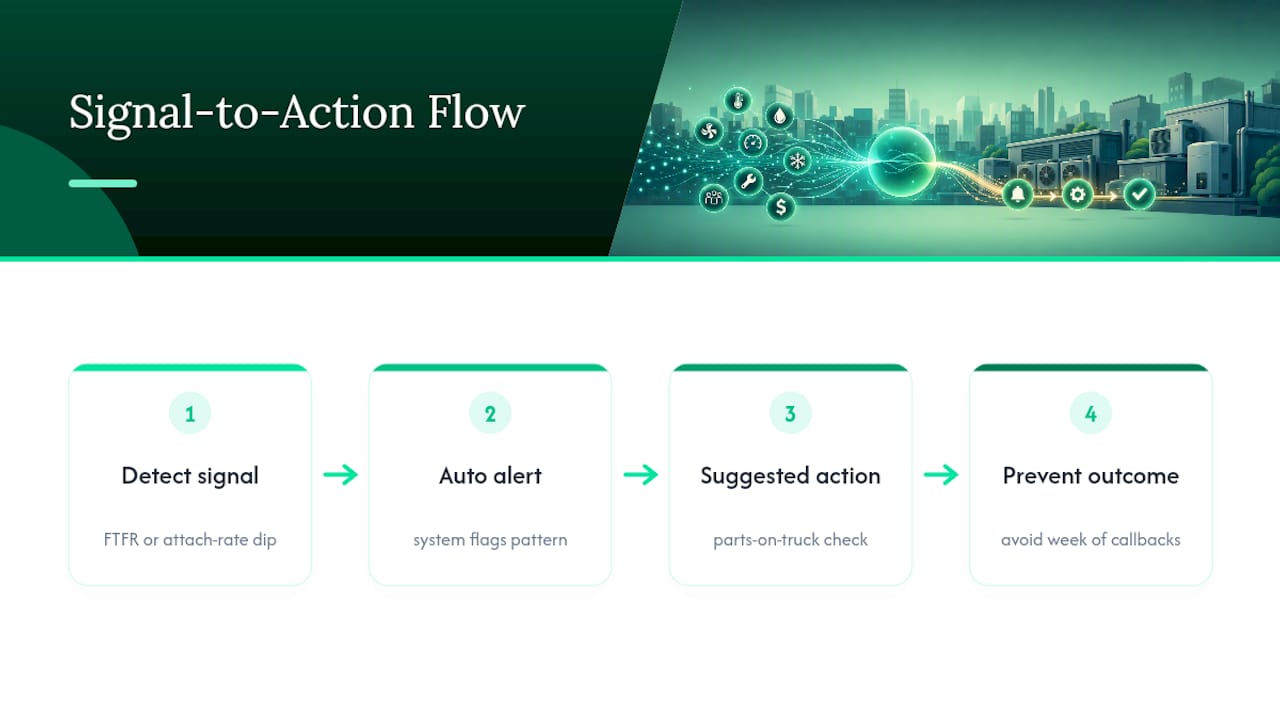
Author: Bernard, editorial lead covering revenue operations for service businesses. Signal Engine Free maps signals like falling FTFR or slipping attach rates into automated alerts with a suggested next step, no spreadsheet required. A dip in first-time fix rate, for example, can trigger an automatic parts-on-truck check before the pattern costs you a week of callbacks. See how the HVAC-specific dashboard handles this.
Why a Short Scorecard Beats a Long KPI List
Most shops don't fail because they track too few metrics. They fail because they track twenty and act on none. Assign an owner to each number, review it on the cadence it deserves, and the metric actually changes behavior. Pick five KPIs, run them hard for 90 days, then decide what to add. Watch for messy job-costing data before you trust any margin number.
— Bernard
Ready to Stop the Revenue Leak?
Tracking HVAC KPIs by hand in a spreadsheet works until you're managing more than a couple of trucks, and then the daily huddle numbers go stale before anyone reads them. An AI-powered platform can replace that spreadsheet with automated alerts tied to metrics such as falling FTFR, slipping attach rates, and revenue per tech that's drifting off target.

Signal Engine gives small and local businesses 31 AI-powered tools to score leads by buying intent, predict churn before it happens, auto-generate email and SMS campaigns, and recover missed calls automatically, all in one dashboard starting at $49/month. It is designed specifically for small service businesses like HVAC shops, with HVAC-specific KPI tracking included. Check out the pricing page for the Free plan details, or see the full feature set for HVAC teams.
Start your free 7-day trial, no credit card required. Setup takes 5 minutes.
Sources
- The Best KPIs for HVAC Contractors in 2027
- Key KPIs for HVAC Businesses | Track What Matters Most
- HVAC Benchmarks 2026: 8 KPIs to Know | Built on Tenth
FAQ
What Are the Five Most Important HVAC KPIs?
The five with the most immediate impact on cash flow are revenue per technician, average repair order, first-time fix rate, service agreement attach rate, and gross margin by job. Revenue per technician typically runs $250,000 to $325,000 for residential operators, and it's the single figure that best summarizes overall crew productivity.
What Skills Should a Strong HVAC Technician Have?
Technicians who move the needle on these KPIs tend to share five traits: solid diagnostic skills, clear communication with customers, comfort presenting pricing options, time management on the route, and basic sales instinct for maintenance agreements. The last two are what separate a tech generating average revenue from one running well above benchmark.
What Are the Top Three KPIs for a Small HVAC Shop?
For a shop with a handful of trucks, start with revenue per technician, first-time fix rate, and service agreement attach rate. These three cover capacity, service quality, and recurring revenue, the three areas most likely to sink a small operation if left unmeasured.
What Are Some Good HVAC KPI Examples Beyond the Basics?
Beyond the core eight, useful examples include billable-hour ratio, callback rate, agreement renewal rate, NPS or CSAT after each job, and review velocity. Each ties to a specific lever, like routing software for billable hours or coaching for callback rate, rather than sitting as a vanity number.
How Often Should I Review My HVAC KPIs?
Review dispatch metrics like revenue per truck and FTFR daily, revenue metrics like average ticket weekly, and margin or renewal metrics monthly. A platform like Signal Engine can automate that cadence so alerts reach you the moment a number drifts, instead of waiting for month-end reporting.