

The seven trucking KPIs every small-to-midsize US carrier and brokerage should track right now are: Net Revenue Retention (NRR), churn rate, average revenue per customer (ARPC), CAC payback period, lead-to-sale conversion rate, pipeline velocity, and missed-revenue detection. These are revenue and customer-health metrics, not fleet or operations metrics, and they connect directly to your cash flow, forecast accuracy, and retention.
Here's your shortlist to copy:
- 📊 Net Revenue Retention (NRR)
- 📉 Churn rate
- 💰 Average Revenue Per Customer (ARPC)
- ⏱️ CAC payback period
- 🔁 Lead-to-sale conversion rate
- 🚀 Pipeline velocity
- 🔔 Missed-revenue detection
These seven give you a complete picture of whether your revenue base is growing, shrinking, or leaking, and they're the metrics a fractional CRO or revenue team should own from day one.
Key Takeaways
Tracking the right trucking KPIs, starting with NRR and churn rate, is the fastest way for SMB carriers to protect revenue and identify growth opportunities before they disappear.
| Point | Details |
|---|---|
| NRR is your primary signal | Target above 105% for contract carriers; below 95% means net shrinkage even with new logos. |
| CAC payback targets | Under 12 months for asset-light models, under 18 months for asset-heavy logistics businesses. |
| Segment before you measure | Separate contract vs. spot customers from day one to get meaningful churn and NRR baselines. |
| Act on two consecutive bad periods | One off-threshold week is noise; two in a row is a trend that warrants a playbook response. |
| Signalengine for SMB trucking | Maps all seven KPIs to automated scoring, churn prediction, and missed-revenue alerts from $49/month. |
Table of Contents
- What do the core trucking KPIs actually measure?
- Where does your KPI data come from?
- How do you set baselines and realistic targets for SMB trucking?
- What should you do when a KPI moves?
- How to implement these KPIs with Signalengine
- Why revenue KPIs matter more than ops metrics for small carriers
- Ready to Stop the Revenue Leak?
- Sources
- FAQ
What do the core trucking KPIs actually measure?
Each metric below includes its formula, the data it pulls from, and the signal it sends when it moves.
| KPI | Formula | Data Sources | Owner |
|---|---|---|---|
| NRR | (Starting MRR + Expansion – Contraction – Churn) ÷ Starting MRR | CRM, invoicing/AR | RevOps / Finance |
| Churn Rate | Churned customers ÷ Total customers at period start | CRM, contract records | Sales / RevOps |
| ARPC | Total revenue ÷ Active customers | Invoicing/AR | Finance / Sales |
| CAC Payback | CAC ÷ (ARPC × Gross Margin %) | CRM, ad spend, AR | Finance |
| Lead-to-Sale Conversion | Closed-won deals ÷ Total leads | CRM pipeline | Sales |
| Pipeline Velocity | (Opportunities × Avg Deal Size × Win Rate) ÷ Sales Cycle Length | CRM | RevOps / Sales |
| Missed-Revenue Detection | Unrecovered missed calls + lost bids + lapsed accounts | Call logs, quote records | Sales / Ops |
NRR is your single most important health signal. Logistics revenue leaders should target NRR above 105% for contract-based carriers and above 95% for transactional brokerages.
Churn rate tells you how fast you're losing customers. A spike here triggers a win-back program before the revenue gap widens.
ARPC tracks whether your pricing is holding. A falling ARPC alongside flat customer count means you're discounting or losing your best accounts.
CAC payback measures how many months it takes to recover what you spent acquiring a customer. Target a CAC payback period that aligns with industry best practices for asset-light and asset-heavy logistics models.
Lead-to-sale conversion and pipeline velocity work together. Pipeline velocity equals (qualified opportunities × average deal size × win rate) ÷ sales cycle length. Improvements across these factors can significantly enhance pipeline velocity. Decompose by segment before acting, or you'll pull the wrong lever.
Missed-revenue detection catches the quiet leaks: unanswered calls, lost bids, and lapsed shippers who never got a follow-up. These are among the most actionable sales KPIs for logistics teams because they represent revenue that was already in reach.
Pro Tip: Never mix ARR from multi-year contracts with monthly spot revenue in the same NRR calculation. Segment contract vs. spot customers from the start, or your NRR will be meaningless noise.
Where does your KPI data come from?
Reliable measurement starts with knowing which system owns which number.
Your primary data sources:
- CRM (HubSpot, Salesforce, or similar): deal value, quote dates, close dates, contract terms, churn reason tags
- Invoicing / AR system (QuickBooks, NetSuite): actual revenue collected, invoice IDs, payment dates
- TMS or booking records: contracted load value, lane assignments, shipment counts
- Call logs and missed-call records: inbound call volume, unanswered calls, callback status
- Quote spreadsheets or load boards: bid IDs, bid amounts, win/loss outcomes
Integration checklist (run this before you measure anything):
- Capture contract value on every deal at close, not at invoice.
- Map invoice IDs back to CRM deal records so revenue ties to the source.
- Tag every churned account with a churn reason and contract end date.
- Log every quote with a unique quote ID so missed-bid detection can match wins and losses.
- Connect call logs to customer records so missed calls surface against known accounts.
Recurring reconciliation rhythm:
- Daily: sync check between CRM and AR to catch missing deal-to-invoice links
- Weekly: sample 10–15 records to verify contract value matches invoiced amount
- Monthly: full reconciliation across all active accounts, plus a missed-bid audit
Building a revenue dashboard without a data team is possible when your fields are clean from the start. Garbage in, garbage out applies harder in trucking than almost anywhere else, because spot revenue and contract revenue look identical in a raw export.
How do you set baselines and realistic targets for SMB trucking?
Start with a 90-day lookback, minimum. Twelve months is better if your business has seasonal lanes.
Baseline method:
- Segment customers into contract vs. spot from day one.
- Compute cohort NRR by contract start month, not calendar month, to remove seasonal freight noise.
- Run a 90-day rolling churn rate alongside the cohort view.
- Use rolling averages (3-month) to smooth one-off losses that aren't trend signals.
Practical SMB target ranges:
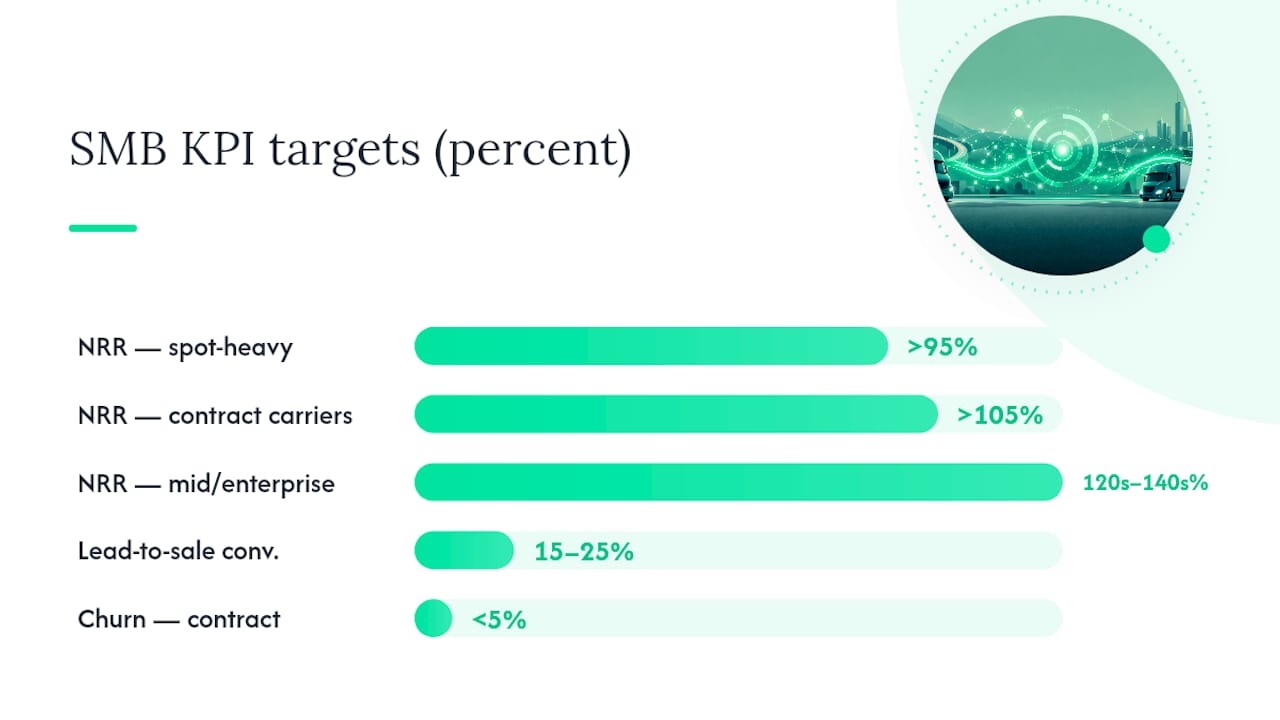
- NRR: above 95% for spot-heavy brokerages; above 105% for contract carriers. TMS and freight-software benchmarks show mid-market and enterprise vendors reaching NRR in the 120s–140s percent, but SMB targets should be set conservatively until data matures.
- CAC payback: under 12 months for asset-light, under 18 months for asset-heavy.
- Lead-to-sale conversion: 15%–25% is a reasonable starting range for SMB trucking sales teams.
- Churn rate: below 5% monthly for contract accounts is a healthy floor.
Worked CAC payback example: A route-based carrier spends $3,600 acquiring a new shipper (sales time + outreach costs). CAC payback = $3,600 ÷ $450 = 8 months. That's well inside the 12-month asset-light target.
Adjust targets when contract renewal cycles cluster (Q1 and Q4 are common in freight), when you add or drop capacity, or when fuel surcharges shift your effective ARPC.
Pro Tip: Don't set a single company-wide churn target. Segment by account size. Losing a $500/month spot shipper and a $15,000/month contract shipper in the same period are not the same event.
What should you do when a KPI moves?
Every KPI needs a playbook, not just a dashboard. Here's how to respond when the numbers shift.
Churn rate spikes:
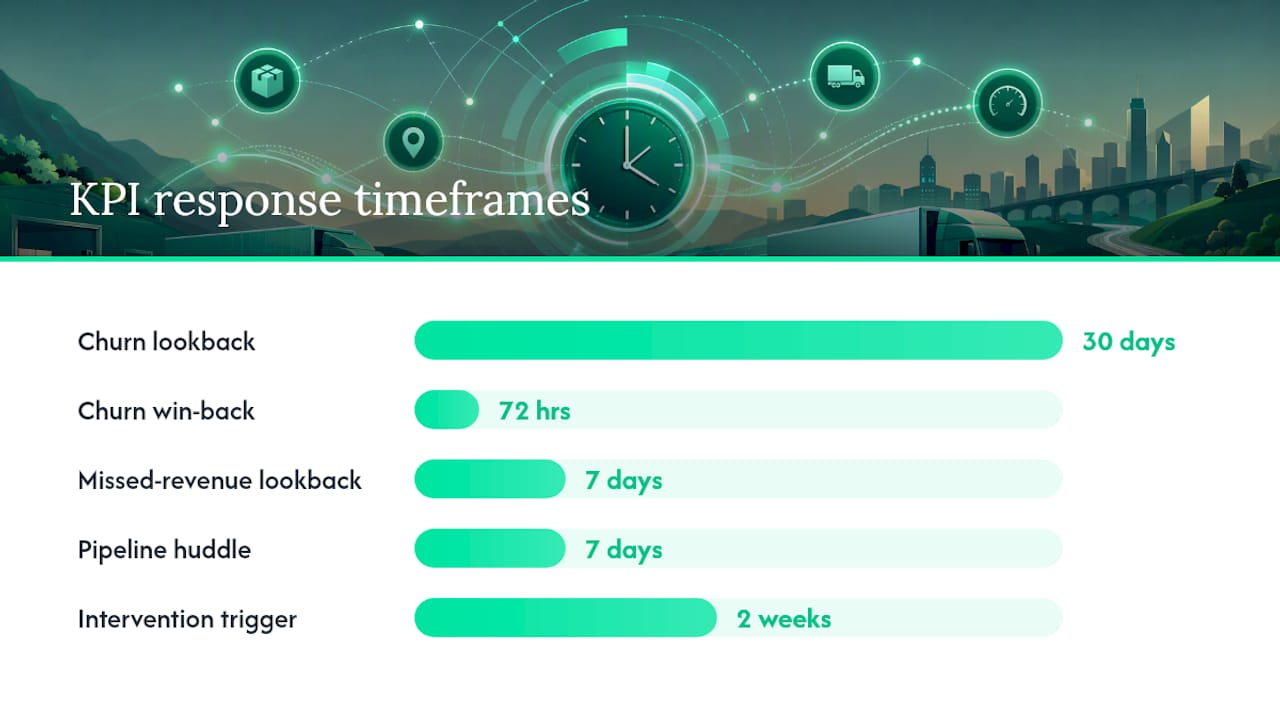
- Pull the list of churned accounts from the last 30 days.
- Identify churn reason tags (price, service, competitor, capacity).
- Assign an owner to each at-risk account still in the pipeline.
- Launch a win-back sequence within 72 hours for accounts lost to price or service.
- Escalate to the CRO or owner if two consecutive periods show churn above threshold.
CAC payback lengthening:
- Check whether deal size dropped or sales cycle extended.
- Tighten lead qualification criteria to remove low-margin shippers.
- Review pricing packaging for entry-level lanes.
- Implement CRM warning flows when deals are quoted outside pricing guidance, which enforces margin discipline without slowing sales.
Pipeline velocity dropping:
- Decompose by segment before acting: volume, deal size, win rate, or cycle length.
- Fix the weakest lever first. A velocity drop driven by a longer sales cycle needs a different fix than one driven by fewer qualified opportunities.
- Run a weekly lane and pipeline huddle with your pricing lead to catch margin leaks early.
Missed-revenue detection alert:
- Pull missed calls and uncontacted leads from the last 7 days.
- Auto-assign follow-up tasks in your CRM.
- Review lost bids for patterns (lane, rate, competitor).
- Use a systematic approach to tracking lost revenue sources to close the loop on bids that never converted.
Pro Tip: Require two consecutive measurement periods showing a KPI outside threshold before triggering a major intervention. One bad week is noise. Two bad weeks in a row is a signal worth acting on.
How to implement these KPIs with Signalengine
Signalengine maps directly to each of the seven KPIs above. Here's the feature-to-KPI match:
Onboarding checklist (5 steps to your first dashboard):
- Connect your CRM and map deal value, close date, and contract type fields.
- Link your invoicing or AR system so actual collected revenue ties to each deal.
- Enable call ingestion to surface missed calls against known customer records.
- Set initial churn and NRR alert thresholds based on your 90-day baseline.
- Activate churn prediction scoring so at-risk accounts surface automatically.
Signalengine's revenue intelligence for logistics and trucking is built for teams without a dedicated data analyst. Setup takes about 5 minutes to connect your first integration, and most SMB trucking teams see their first churn-risk flags within the first two weeks.
Pro Tip: Start with churn prediction and missed-call recovery first. These two features surface the fastest wins because they catch revenue that's already in motion, not revenue you still have to earn.
Why revenue KPIs matter more than ops metrics for small carriers
Most trucking KPI articles lead with fuel efficiency, idle time, and on-time delivery. Those metrics matter for operations. They don't tell you whether your business is growing or dying.
NRR and CAC payback are cash-flow metrics in disguise.
Revenue KPIs also drive three outcomes that ops metrics can't touch: forecast accuracy (you can't predict revenue from on-time delivery rates), retention-driven growth (expanding existing accounts costs a fraction of acquiring new ones), and pricing discipline (lane-margin floors and governance triggers only work when revenue data feeds them).
The carriers who grow aren't necessarily the ones with the best trucks. They're the ones who know which customers are about to leave, which bids they're losing, and exactly how much revenue is sitting unreturned in a missed call queue.
Ready to Stop the Revenue Leak?
Your seven KPIs are only as good as the system watching them. Signalengine gives SMB trucking and logistics teams a purpose-built revenue intelligence platform that scores every customer automatically, flags churn risk before it costs you a contract, and recovers missed calls without manual follow-up.

Signalengine's SMB pricing starts at $49/month, with no data team required and a 5-minute setup. You can also book a live demo to see the pipeline tracking, churn prediction, and missed-revenue detection features mapped to your specific routes and accounts.
Signal Engine gives small and local businesses 31 AI-powered tools to score leads by buying intent, predict churn before it happens, auto-generate email and SMS campaigns, and recover missed calls automatically — all in one dashboard starting at $49/month.
Start your free 7-day trial — no credit card required. Setup takes 5 minutes.
Sources
For benchmarking:
- What KPIs should a fractional CRO own at a logistics company?
- How do you architect revenue operations for a logistics + supply…
- pipeline-velocity
- Mastering Sales in Logistics A Guide for 2026 | Coreties Blog
For implementation:
FAQ
What are the most important KPIs for a small trucking company?
NRR, churn rate, ARPC, CAC payback, lead-to-sale conversion, pipeline velocity, and missed-revenue detection are the seven that matter most for revenue health. These logistics KPIs connect directly to cash flow and retention, unlike operational metrics.
What is a good NRR target for an SMB trucking business?
How do you calculate CAC payback for a trucking company?
Divide your total customer acquisition cost by monthly gross profit per customer (ARPC × gross margin %). A carrier spending $3,600 to acquire a shipper generating $450/month in gross profit has an 8-month CAC payback.
How often should a trucking company review its revenue KPIs?
Run daily sync checks on CRM-to-AR data, weekly pipeline and churn reviews, and a full monthly reconciliation. A weekly lane and pipeline huddle keeps margin leaks visible in real time.
Can Signalengine track these KPIs for a small trucking team?
Yes. Signalengine maps all seven KPIs to automated features including churn prediction, pipeline tracking, missed-call recovery, and behavior scoring, with logistics-specific revenue intelligence starting at $49/month.