

For most teams working with flat customer tables, a well-tuned gradient-boosted tree model like XGBoost or LightGBM delivers the best balance of accuracy and production readiness. Switch to relational, graph, or sequential architectures once your data spans multiple joined tables or event streams. Either way, the biggest performance gains come from better data and feature engineering, not from swapping algorithms.
TL;DR:
- Using flat customer tables with gradient-boosted trees like XGBoost or LightGBM offers the best balance of accuracy and simplicity for most teams.
- Differentiating voluntary and involuntary churn models improves intervention targeting and prevents wasted retention efforts.
- Prioritizing usage, billing, support, and demographic data, with at least 90 days of history, significantly boosts prediction quality over raw features alone.
- Tree ensemble models outperform logistic regression in nonlinear, structured data, while neural networks excel with sequential logs, and survival models predict timing rather than binary outcomes.
- Addressing class imbalance with proper metrics like PR AUC, resampling techniques, and calibrated thresholds is crucial for reliable churn prediction.
Table of Contents
- What Is Churn Prediction and Why Does It Matter?
- Voluntary vs. Involuntary Churn: Why the Distinction Changes Your Model
- What Data and Signals Should You Collect First?
- Which Model Family Should You Choose for Customer Churn Prediction?
- How Do You Handle Imbalanced Data When Predicting Churn?
- Feature Engineering: The Highest-Leverage Work You'll Do
- Turning Model Scores Into Retention Actions
- How Do You Validate and Monitor Churn Models Over Time?
- Building a First Churn Prediction Pilot: A Step-by-Step Playbook
- How Signal Engine Applies These Practices for Small Businesses
- What Deployment Actually Teaches You
- Ready to Stop the Revenue Leak?
- Sources
- FAQ
What Is Churn Prediction and Why Does It Matter?
Churn prediction is the practice of scoring which customers are likely to stop paying, and it comes in two flavors that get conflated too often. Binary churn prediction asks a yes/no question over a fixed window ("will this customer cancel in the next 30 days?"). Time-to-event modeling asks a different, richer question: when will this customer likely churn, and how does risk change over their lifecycle? The second approach, borrowed from survival analysis, tends to produce more actionable timing signals for retention teams.
The financial case is straightforward. Acquiring a replacement customer almost always costs more than saving an existing one, and even a small drop in monthly churn compounds into a large swing in annual recurring revenue. That is why churn prediction machine learning has become standard practice at subscription businesses of every size, not just enterprise SaaS.
Prediction earns its keep in a few recurring situations:
- Renewal cycles, where a risk score triggers outreach weeks before a contract lapses.
- Involuntary churn, where a failed card or expired payment method is fixable if caught early.
- Product disengagement, where usage decline signals dissatisfaction long before a cancellation request arrives.
Each of these calls for a slightly different model and a different intervention, which is the next problem worth solving.
Voluntary vs. Involuntary Churn: Why the Distinction Changes Your Model
Lumping every canceled account into one "churn" label is the single most common mistake in early churn modeling. Voluntary and involuntary churn have different causes, different lead times, and different fixes.
- Voluntary churn happens when a customer actively decides to leave, driven by poor product fit, a competitor switch, or a support failure. These customers usually leave a behavioral trail: declining logins, unanswered emails, or a spike in support tickets.
- Involuntary churn happens when a payment fails, a card expires, or a billing system error cancels an account nobody meant to cancel. This churn shows up in transactional and billing data long before it shows up in behavior.
- Labeling windows must match the churn type. A voluntary-churn model might use a 60 or 90 day pre-cancellation window built from usage and support signals. An involuntary-churn model can use a much shorter window built almost entirely from billing events, since the signal (a failed charge) is immediate and specific.
Getting this split right changes the intervention, too. Voluntary churn calls for a human touch (a call, a personalized offer, a feature walkthrough). Involuntary churn often just needs an automated retry, a card-update prompt, or a dunning email sequence. Modeling both churn types with one undifferentiated label muddies the signal and wastes retention budget on customers who never intended to leave.
What Data and Signals Should You Collect First?
Data quality determines your ceiling long before algorithm choice does. Practical tutorials on churn modeling consistently show that exploratory data analysis and thoughtful feature construction, not fancier models, separate strong pipelines from mediocre ones, according to Dataiku's churn prediction guide. Prioritize these signal categories:
- Usage and behavioral signals: login frequency, feature adoption, session depth, and time since last meaningful action.
- Transactional and billing signals: payment failures, downgrade events, invoice disputes, and tenure.
- Support signals: ticket volume, resolution time, and ticket category (a billing complaint predicts differently than a feature request).
- Demographic and firmographic context: plan tier, company size, industry, and acquisition channel.
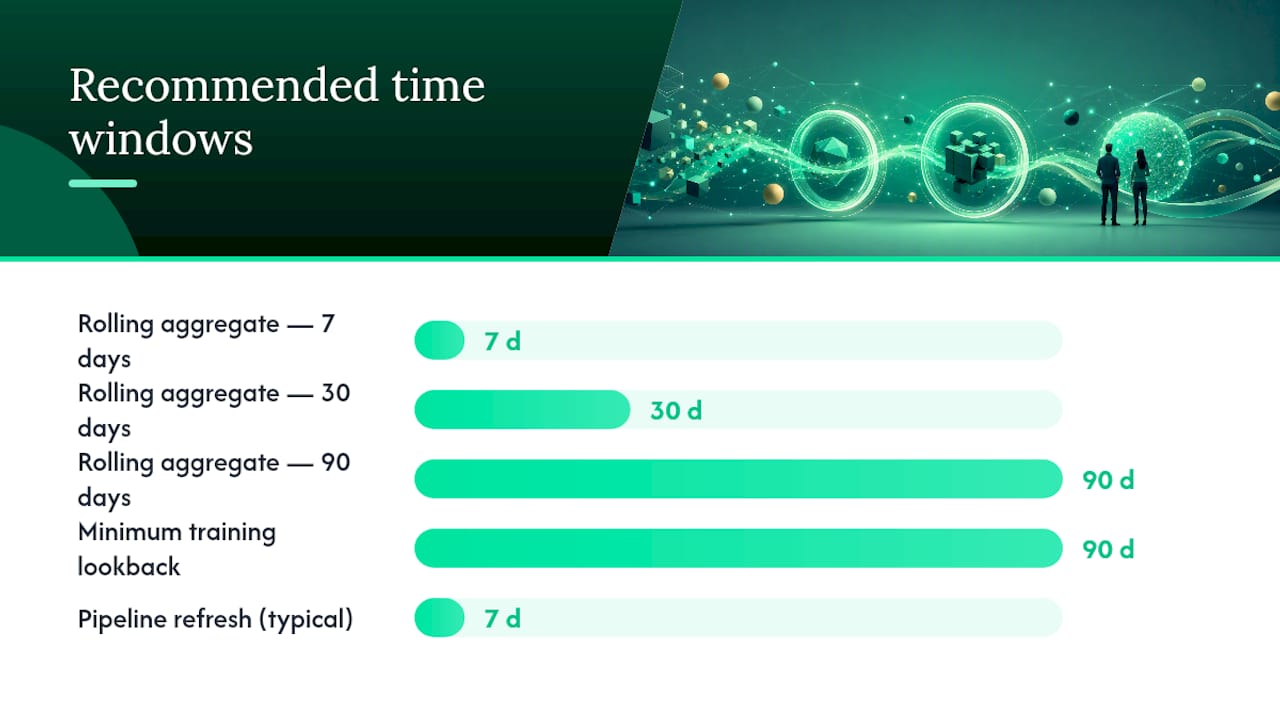
From these raw fields, derived features usually carry more predictive weight than raw counts. Rolling 7, 30, and 90 day aggregates catch momentum shifts. RFM-style features (recency, frequency, monetary value) borrowed from marketing analytics translate cleanly into churn prediction features. Event-rate ratios, like support tickets per active day, often outperform either raw metric alone.
Pro Tip: Build at least 90 days of lookback history before you train anything. Shorter windows miss slow-burn disengagement patterns, and your model will overfit to short-term noise instead of learning the real signal.
A minimum viable pipeline refreshes these features weekly for most B2B subscription businesses; daily refresh is worth the engineering cost only when your product has high-frequency usage data, like a mobile app or a marketplace.
Which Model Family Should You Choose for Customer Churn Prediction?
There's no universal winner among customer churn prediction models. The right family depends on your data shape, team capacity, and how much interpretability the business demands.
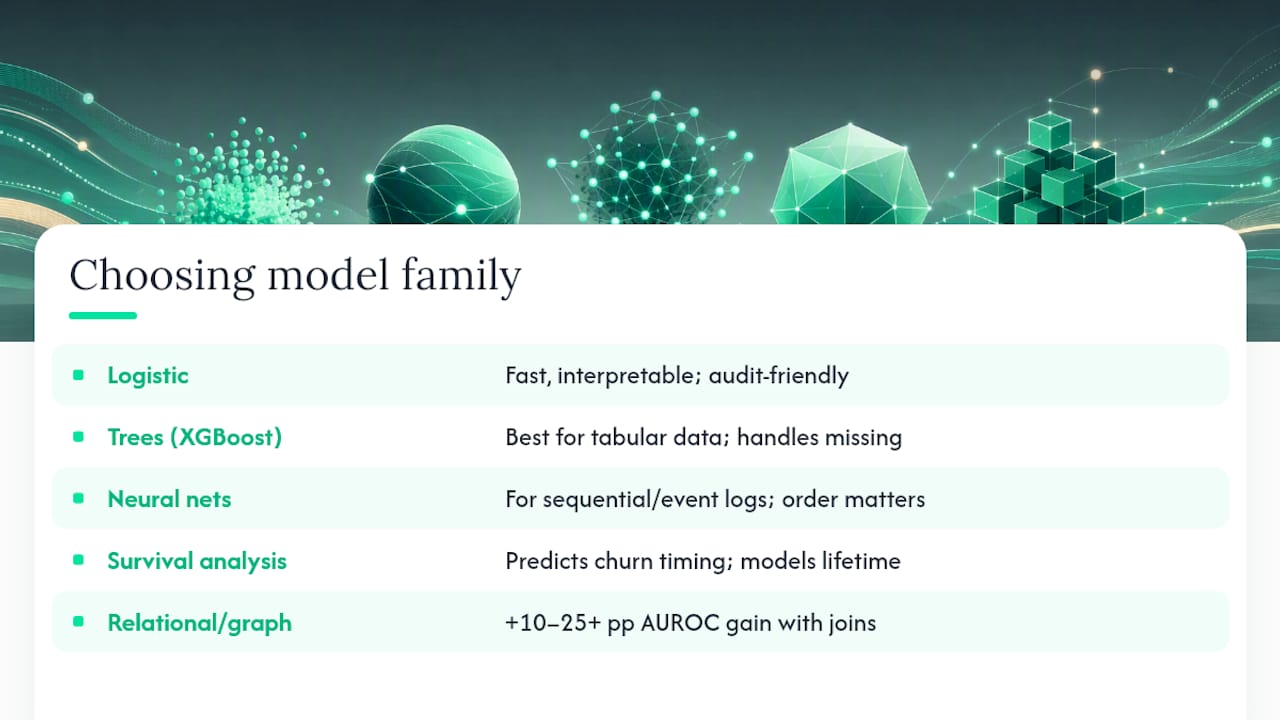
Logistic regression remains a defensible baseline. It trains fast, coefficients are directly interpretable, and it forces you to confront collinearity and feature scaling early. Expect it to underperform tree ensembles on nonlinear interactions, but it's often the model that survives an audit or a regulatory review.
Tree ensembles, particularly XGBoost and LightGBM, dominate the field for flat, tabular churn data. A systematic review of churn research confirms that ensemble methods remain the strongest baseline across ML studies on structured customer tables, even as deep learning approaches gain ground for sequential and multi-table problems, per the MDPI systematic review of churn prediction methods. They handle missing values gracefully, capture nonlinear feature interactions without manual encoding, and pair well with SHAP for explainability.
Neural networks, especially LSTMs, earn their complexity when you have genuinely sequential data: clickstream logs, session-by-session behavior, or large-volume event streams where order matters. If your dataset is a monthly snapshot table, a neural net is usually overkill; if it's raw event logs at scale, it can outperform tree models on pattern detection.
Survival analysis (Cox proportional hazards, or gradient-boosted survival models) answers a different question than classification: not just who churns, but when. This matters enormously for revenue forecasting, since it lets finance teams model expected customer lifetime rather than a single point-in-time probability.
Relational and graph-based models represent the biggest paradigm shift available today. Instead of flattening every join into one wide feature table, they operate directly on the relationships between customers, transactions, support tickets, and usage events. Benchmarks show relational approaches adding a step-change over flat-table models, with gains of 10 to 25-plus percentage points in AUROC when multi-table signals are properly exploited, according to Kumo. If your flat-table model has plateaued, this is usually a bigger lever than any hyperparameter search.
How Do You Handle Imbalanced Data When Predicting Churn?
Most churn datasets are heavily imbalanced. This is the trap that catches teams new to predictive analytics for churn.
Accuracy is the wrong metric here. On imbalanced churn data, prioritize precision, recall, and PR AUC or ROC AUC instead, and lean on resampling techniques like SMOTE or hybrid under-sampling to rebalance training data, per Microsoft's Fabric documentation on customer churn.
A 5% churn rate means a "predict nothing churns" model scores 95% accuracy while flagging zero at-risk customers. That single fact is why PR AUC, not accuracy, belongs on your model report.
Practical levers, roughly in order of how often teams reach for them:
- PR AUC over ROC AUC when the positive class (churners) is rare and business cost is asymmetric.
- Precision@k and lift to answer the question retention teams actually care about: "of the top 500 flagged customers, how many really churn?"
- SMOTE, ADASYN, or hybrid under-sampling to rebalance training data, using imbalanced-learn's over-sampling toolkit as the standard reference implementation.
- Class weights or
scale_pos_weightin XGBoost as a lighter-touch alternative to resampling, adjusting the loss function instead of the dataset itself. - Calibration plots to confirm predicted probabilities actually mean what they claim. A model that assigns 0.8 to a group where only 40% churn is miscalibrated and will mislead prioritization.
Feature Engineering: The Highest-Leverage Work You'll Do
Feature engineering, not algorithm selection, is where most of the measurable improvement in churn rate analysis actually happens. Time-windowed aggregates, cohort features, and RFM-style scores consistently beat swapping one gradient booster for another, per 365 Data Science's tutorial on churn modeling in Python.
- Separate your backward window from your label window. Features come from history (say, the 90 days before the observation point); the label comes from what happens after (did they churn in the following 30 days?). Blurring this boundary causes leakage, where the model accidentally learns from the future.
- Build cohort and RFM features. Signup month, plan tier at signup, and recency/frequency/monetary scores capture behavior patterns that raw event counts miss.
- Add interaction features where domain knowledge suggests them, such as support tickets divided by tenure, which flags customers who are newly frustrated rather than chronically difficult.
- Push toward relational features once flat tables plateau. Joining transaction, support, and usage tables directly, rather than pre-aggregating everything into one row per customer, is consistently the highest-leverage move once flat feature engineering runs out of gains, according to Kumo.ai's analysis of relational churn modeling.
Pro Tip: Before adding a new feature, ask whether it could only have existed after the churn event. If a support ticket was filed as a cancellation request, it can't be a predictive feature. That's leakage disguised as a signal.
Engineering-wise, precompute rolling aggregates in batch rather than on the fly, and cache join results when your relational tables update on different cadences (usage data hourly, billing data daily).
Turning Model Scores Into Retention Actions
A churn score with no explanation is a number nobody trusts enough to act on. Explainable AI, specifically SHAP and LIME, translates model output into drivers a retention team can actually use. SHAP values decompose each prediction into the contribution of each feature, both globally (which features matter most across all customers) and locally (why this specific customer scored 0.82).
Research combining tabular benchmarking with SHAP analysis consistently surfaces the same handful of drivers across churn studies: tenure, support ticket volume, and monthly charges, per Springer Nature's benchmark of explainable churn prediction models. That consistency is useful. It means you can build rule-based escalation logic on top of the model rather than treating every score as a black box.
- Global SHAP tells you which features drive churn risk across your whole customer base, useful for prioritizing where to invest in product or support fixes.
- Local SHAP tells you why one customer scored high, which is what a customer success rep actually needs before making a call.
- Simple rules derived from SHAP patterns work well operationally: escalate any customer with three or more open tickets and high monthly charges to a senior success manager within 24 hours.
- Calibrated thresholds convert continuous scores into risk buckets (high, medium, low) that map cleanly to different intervention budgets.
Tenure, ticket count, and monthly charge show up again and again as the strongest churn drivers across explainability studies, which is exactly why they belong at the center of any escalation rule you build.
Track intervention ROI the same way you'd track a marketing campaign: cost per save, save rate by risk bucket, and net revenue retained. A platform like Signal Engine's churn intervention automation can help route these flagged accounts into the right outreach sequence automatically.
How Do You Validate and Monitor Churn Models Over Time?
A model that performed well in a notebook and a model that performs well in production for eight months are different problems. The gap between them is validation rigor and monitoring discipline.
Nested cross-validation is the standard for honest model comparison and hyperparameter tuning. An outer loop evaluates generalization performance while an inner loop tunes hyperparameters, which prevents the optimistic bias that comes from tuning and evaluating on the same folds. Benchmarking studies that use nested cross-validation alongside metrics like PR AUC and ROC AUC produce comparisons that hold up when the model actually ships, according to Springer Nature's tabular ML benchmark of churn models.
Once deployed, three kinds of drift threaten model reliability:
- Feature drift, where the distribution of input features shifts (a pricing change alters "monthly charge" distributions overnight).
- Label delay, where you don't know the true outcome for weeks, which complicates fast feedback loops.
- Concept drift, where the actual relationship between features and churn changes, often after a product overhaul or a new competitor enters the market.
Retrain on a fixed cadence, monthly or quarterly for most subscription businesses, and retrain sooner if monitoring flags a drift alert. Log every prediction, the eventual outcome, and whether an intervention fired, so you can audit model decay and intervention effectiveness in the same dataset instead of piecing it together after the fact.
Building a First Churn Prediction Pilot: A Step-by-Step Playbook
- Choose a backward window (60 to 90 days of history) and a label window (30 days forward) that match your billing cycle and typical cancellation notice period.
- Score every active customer weekly and sort them into three risk bands: high, medium, and low.
- Assign a specific intervention recipe per band. High risk might get a personal call plus a discount offer; medium risk gets an automated email sequence; low risk gets nothing beyond routine engagement tracking.
- Run interventions as an A/B test, holding out a control group in each band, and measure the difference in actual churn between treated and control groups.
| Metric | What it tells you | Target cadence |
|---|---|---|
| Retention lift | Difference in churn rate between treated and control groups | Reviewed monthly |
| Cost per saved customer | Total intervention spend divided by customers retained | Reviewed monthly |
| Save conversion rate | Share of flagged high-risk customers who stay after intervention | Reviewed weekly |
Reducing customer churn this way turns a model score into a measurable business result instead of a dashboard nobody checks. Retention teams applying structured plays like this often lean on resources such as Ahead of Sales's SaaS retention training to build the muscle for executing save conversations consistently.
How Signal Engine Applies These Practices for Small Businesses
Signal Engine takes this exact framework, scoring, explainability, and automated intervention, and packages it for teams that don't have a data science department. The platform's churn prediction engine scores customers automatically, flags risk in early-warning dashboards, and triggers campaign outreach without manual model babysitting.
For small and midsize businesses across HVAC, dental, real estate, logistics, and eight other verticals, this matters because most SMBs don't have enough historical data to train custom relational models from scratch. Signal Engine solves that with:
- Pre-built scoring tuned per vertical, so a landscaping business and a dental practice aren't judged against the same churn baseline.
- Automated early-warning alerts the moment risk crosses a threshold, no manual dashboard-checking required.
- Auto-generated email and SMS campaigns tied directly to risk bands.
- Setup measured in minutes, not the weeks a custom pipeline typically demands.
What Deployment Actually Teaches You
Two lessons repeat across every churn deployment worth studying. First, the model that wins on a leaderboard rarely wins in production if nobody trusts its output. Interpretability isn't a nice-to-have bolted on after the fact. It's what gets a retention manager to actually pick up the phone.
Second, small experiments beat big rewrites. Launch one risk band, one intervention, and measure the lift before touching your feature pipeline again. Teams that chase model sophistication before closing the loop on a single, measurable intervention usually end up with an impressive AUROC and no change in actual retention. Keep the feedback loop tight, keep the outcome interpretable, and let the data tell you when it's time to add complexity.
— Bernard
Ready to Stop the Revenue Leak?
You've just read what it takes to build, validate, and operationalize a churn model from scratch, and the truth is most small businesses don't have the time or team to do it themselves. Signal Engine closes that gap.

Signal Engine gives small and local businesses 31 AI-powered tools to score leads by buying intent, predict churn before it happens, auto-generate email and SMS campaigns, and recover missed calls automatically, and all in one dashboard starting at $49/month. Instead of hiring a data science team to build the pipeline described above, you get scoring, early warnings, and campaign automation live in your dashboard from day one.
Start your free 7-day trial — no credit card required. Setup takes 5 minutes.
Sources
- Customer churn guidance — Microsoft Fabric documentation
- Customer Churn Prediction: A Systematic Review of Recent Advances, Trends, and Challenges in Machine Learning and Deep Learning — MDPI
- Kumo
FAQ
Which Model Is Best for Churn Prediction?
For flat, tabular customer data, gradient-boosted tree ensembles like XGBoost and LightGBM are the strongest general-purpose choice. Switch to relational or graph-based models once your data spans multiple linked tables, since benchmarks show those approaches adding significant AUROC gains over flat-table models.
What Are the Algorithms Used for Churn Prediction?
The most common algorithms are logistic regression, random forests, XGBoost, and LightGBM for tabular data, LSTMs or other neural networks for sequential clickstream data, and survival analysis models like Cox proportional hazards when timing matters more than a binary yes/no outcome.
What Is a Churn Scoring Model?
A churn scoring model assigns each customer a probability, typically between 0 and 1, representing their likelihood of canceling within a defined window. Teams then bucket these scores into risk tiers, like high, medium, and low, to prioritize retention outreach and budget accordingly.
How Do You Calculate Churn Prediction Accuracy?
Standard accuracy is misleading on imbalanced churn data, so use PR AUC, ROC AUC, precision, and recall instead, paired with calibration plots to confirm predicted probabilities match observed outcomes. Precision@k, measuring how many of your top-flagged customers actually churn, is often the most business-relevant metric of all.
Can Signal Engine Replace a Custom-Built Churn Model?
For most small and midsize businesses, yes. Signal Engine's churn prediction software applies pre-tuned scoring and automated intervention workflows without requiring an in-house data science team to build and maintain the pipeline.