

TL;DR:
- Monitoring a compact health score that weights relationship signals predicts churn more effectively than tracking many metrics. Combining usage drops with early relational and conversational signals provides a 30 to 90-day window for intervention. Signalengine automates this process by scoring accounts, firing alerts, and triggering outreach to reduce customer churn.
Your fastest wins come from a compact 5–7 metric health score that weights relationship and sentiment signals alongside product usage data. Most teams track too many metrics and act too late. The accounts most likely to churn are already signaling their exit 30–90 days out, and the signals worth watching right now are:
- Login frequency vs. baseline (drop of 40%+ over 14 days)
- Feature breadth contraction (fewer distinct features used per 30-day window)
- Export or download spikes (data extraction behavior 15–30 days before cancellation)
- Billing page visits (three or more visits in 30 days raises risk sharply)
- Champion departure or role change (often the earliest signal of all)
- Conversational sentiment shift (shorter replies, transactional tone in emails or tickets)
The single immediate action: wire one automated alert to your top two signals and pair it with a lightweight conversational check-in cadence for any account that trips a yellow threshold. That combination covers the full 30–90 day lead-time window where intervention actually works.
TL;DR: Usage-based churn prediction models reach accuracy levels that significantly outperform survey-based methods at a 30-day horizon. Conversational and relationship signals fire even earlier, often 60–90 days before cancellation. Start with the health score, add one alert, and run one check-in cadence. That is the 24–72 hour playbook.
Table of Contents
- What is a churn signal and why does it predict churn before billing does?
- Which 5–7 metrics should anchor your product health score?
- How do you build a churn and retention dashboard that actually works?
- Should you use threshold rules or machine learning to detect churn risk?
- What should you do when a churn signal fires?
- How do you operationalize detection with clear owners, SLAs, and experiments?
- Why a compact health score works better than tracking everything
- Key Takeaways
- The gap between what churn prediction promises and what actually moves the needle
- Signalengine catches churn signals before your team even notices them
- Useful sources
- FAQ
- Ready to Stop the Revenue Leak?
What is a churn signal and why does it predict churn before billing does?
A churn event is the outcome: a cancellation, a non-renewal, a downgrade. A churn signal is a leading indicator, a behavioral or relational change that precedes that outcome by weeks or months. The distinction matters because by the time a billing event fires, save rates drop, while intervening during the 4–12 week decay phase can recover a substantial portion of at-risk accounts.
The 30–90 day lead-time window is where your program lives or dies. Usage telemetry (logins, feature activations, session depth) tends to show degradation 30–60 days out. Human and relationship signals, specifically champion departure and conversational tone shifts, often appear 60–90 days before cancellation, making them the earliest warning layer you have.
Here is the practical difference: an account with stable weekly logins but a departed champion and shorter, more transactional email replies is at high churn risk. A pure usage-based model misses it entirely. That is why both signal types belong in your health score, and why weighting them together outperforms tracking either in isolation.
Signal timing at a glance: Usage drops appear roughly 30–60 days before cancellation. Conversational and relationship signals appear 60–90 days out, making them the earliest detectable warning layer in most SaaS products.
Which 5–7 metrics should anchor your product health score?
Industry leaders recommend a compact health score of 5–7 core engagement metrics tied to value delivery. Teams that track dozens of metrics without a unified weighting strategy produce noisy alerts and low save rates. The goal is a score where every metric earns its place by correlating to delivered account value.

Here are the seven metrics worth including, with measurement guidance for each:
| Metric | Window | Yellow threshold | Red threshold | Suggested weight |
|---|---|---|---|---|
| Login frequency vs. baseline with a significant drop over a 14-day window indicates increasing risk. | ||||
| Feature breadth (distinct features used) over 30 days showing noticeable contraction is a risk signal. | ||||
| Session depth (actions per session) over 30 days showing meaningful drop is a risk signal. | ||||
| Active seats ratio (active / licensed) over 30 days dropping below certain thresholds indicates risk. | ||||
| Export / download events showing a spike relative to baseline over a 15-day window suggests potential churn risk. | ||||
| Billing page visits over 30 days, with multiple visits, signal increasing churn risk. | ||||
| Champion status or conversational sentiment changes, such as a role change or departure, are ongoing risk indicators. |
How to measure each one:
- Login frequency vs. baseline: Numerator = logins in the current 14-day window. Denominator = average logins in the prior three 14-day windows. A ratio below 0.6 is yellow; below 0.5 is red.
- Feature breadth: Count distinct
feature_activatedevent types per account per 30 days. Compare to the account's own 90-day rolling average. A contraction of 30%+ is a yellow flag; 50%+ is red. - Session depth: Average
events_per_sessionin the current 30-day window vs. prior 90-day average. Captures whether users are doing meaningful work or just checking in. - Active seats ratio:
(seats with at least one login in 30 days) / licensed_seats. Seat reduction can precede churn by 60–90 days. - Export / download spikes: Flag accounts where
export_completedordownload_initiatedevents exceed 2x their 30-day baseline in any 15-day window. Data extraction behavior often signals a migration in progress. - Billing page visits: Track
page_viewedevents wherepage_pathcontains/billingor/subscription. One visit doubles churn risk; three or more visits in 30 days raises risk markedly. - Champion status / sentiment: Log CRM role changes for primary contacts. Score conversational sentiment from support ticket subjects and email reply length as a proxy.
Normalizing across accounts: New accounts (under 90 days) lack a reliable baseline, so use cohort averages from accounts at the same lifecycle stage rather than the account's own history. Established accounts use their own rolling 90-day baseline. This prevents new-account cold-start from flooding your alert queue with false positives.
Worked example: Account A has a login ratio of 0.55 (yellow, 20% weight = 0.11), feature breadth contraction of 35% (yellow, 20% weight = 0.11), session depth drop of 20% (green, 15% weight = 0.15), active seats ratio of 65% (green, 15% weight = 0.15), no export spike (green, 10% weight = 0.10), one billing page visit (yellow, 10% weight = 0.05), and a champion role change flagged (yellow, 10% weight = 0.05). Composite score: 0.72 out of 1.0. Yellow alert fires. CSM outreach within five business days.
Pro Tip: Use your own account health score framework as the single source of truth shared across CSM, product, and sales. When everyone reads the same score, escalation conversations become faster and less political.
How do you build a churn and retention dashboard that actually works?
The dashboard is only as good as the data flowing into it. Start with these five integration points before you touch any visualization tool:
- Product analytics events (logins, feature activations, exports, session metadata)
- CRM contacts and roles (champion names, titles, last-activity dates, role changes)
- Billing page events (subscription page visits, plan-change attempts, payment failures)
- Support ticket metadata (ticket volume, category, sentiment tags from subject lines)
- Conversation logs (email reply length, tone flags, check-in response rates)
Robust event tracking is the foundation. Without clean instrumentation for clicks, feature activations, logins, exports, and API calls, every downstream metric is unreliable.
Build sequence and timeline
Week 1 (quick wins): Instrument the top three product events if not already tracked (login, feature_activated, export_completed). Map events to account IDs. Pull billing page visit data from your web analytics layer. Estimated effort: 2–3 engineering days.

Week 2: Join product events to CRM account records. Calculate baseline login frequency and feature breadth for all accounts with 90+ days of history. Build a simple spreadsheet or BI query that outputs the raw metric values per account. Estimated effort: 1 data analyst day.
Week 3: Build the composite health score query. Assign weights per the table above. Output a per-account score updated daily. Connect to a dashboard tool (Looker, Metabase, or your existing BI layer). Estimated effort: 2–3 analyst days.
Week 4: Add alert routing. Configure threshold-based alerts so yellow scores trigger a CSM task in your CRM and red scores trigger an immediate Slack notification to the account owner and their manager. Estimated effort: 1 day.
Visualization recommendations
- Cohort retention curves: Show 30/60/90-day retention by signup cohort. Reveals whether churn is a new-account problem or an established-account problem.
- Feature breadth heatmap: Rows = accounts, columns = feature categories, color = usage intensity. Instantly shows which accounts are narrowing their workflow.
- Signal timeline per account: A horizontal timeline showing when each signal fired for a given account. Gives CSMs the full story before a call.
- Health score distribution: A histogram of all account scores updated daily. Lets leadership see portfolio risk at a glance.
Alert routing: Yellow alerts go to the assigned CSM with a five-business-day SLA. Red alerts go to the CSM and their manager simultaneously, with a 24-hour response SLA. For strategic accounts (top 20% by ARR), red alerts also notify the AE. You can automate this alert routing so no signal falls through the cracks.
Should you use threshold rules or machine learning to detect churn risk?
Both have a place. The choice depends on your data volume, labeled history, and team capacity.
Rule-based thresholds are fast to implement, easy to explain to stakeholders, and require no historical churn labels. A rule like "flag any account where login frequency drops significantly in a short window" is live in a day. The downside: rules treat each signal independently and miss accounts where multiple weak signals combine into a strong risk pattern.
Supervised ML models combine weak signals into a single probability score and, when trained on 12+ months of labeled churn history, outperform rules on precision and recall. Usage-based models reach high accuracy at a 30-day horizon, compared to survey-based methods that show notably lower accuracy at the same horizon.
Model accuracy benchmark: Usage-based churn prediction achieves 70–80% accuracy at a 30-day prediction horizon. Conversational signal models can surface risk 2–3 weeks earlier than traditional telemetry-only approaches.
Model evaluation metrics your team must track
- Precision at T-30: Of accounts flagged as at-risk 30 days before renewal, what percentage actually churned? Target 65%+.
- Recall: Of accounts that actually churned, what percentage did your model flag in advance? Target 70%+.
- False positive rate: Accounts flagged but retained without intervention. High false positives burn CSM capacity and erode trust in the system.
- ROC/AUC: Overall discriminative power of the model across all thresholds. Useful for comparing model versions.
- Expected lead time: Average days between first flag and actual churn event. Longer lead time = more intervention opportunity.
Common pitfalls and how to avoid them
- Cold-start for new accounts: New accounts have no baseline. Use cohort averages from lifecycle-matched accounts until 90 days of history accumulates.
- Baseline drift: Seasonal usage changes (summer slowdowns, fiscal year-end spikes) can trigger false alerts. Recalculate baselines quarterly.
- Label leakage: If your training data includes signals that only appear after the churn decision is made (like a cancellation page visit on the day of cancellation), your model will look accurate in training but fail in production. Audit your feature engineering carefully.
- Overfitting to late signals: Models trained on data from the final 7 days before churn learn to detect cancellations, not predict them. Train on signals from T-60 and earlier.
When to pick rules, when to pick ML, when to combine:
- Pick rules when you have fewer than 200 churned accounts in your history or need to explain every flag to a non-technical stakeholder.
- Pick ML when you have 12+ months of labeled churn data and a data analyst who can maintain the model.
- Combine both when you want rules to catch obvious cases immediately and ML to surface subtle multi-signal patterns for your CSM team.
What should you do when a churn signal fires?
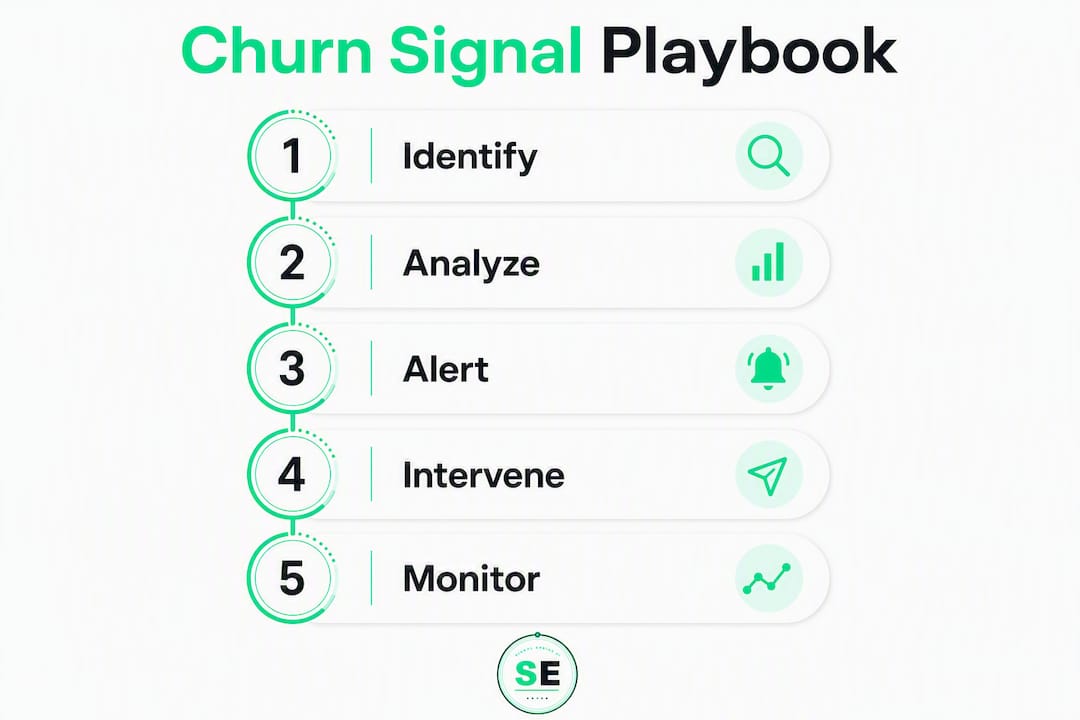
Speed and specificity are what separate a 30% save rate from a 10% one. Here are five playbooks mapped to the most common signals.
1. Login frequency drop (yellow alert)
2. Export or download spike (immediate review)
3. Billing page visits (3+ in 30 days)
4. Champion departure (red alert)
- Success metric: — New champion identified and engaged within 14 days.
5. Silence signal (no response to two consecutive check-ins)
Pro Tip: Map every churn intervention playbook to a specific signal, not a general "at-risk" label. CSMs who know exactly which signal fired take faster, more targeted action than those working from a vague risk score alone.
How do you operationalize detection with clear owners, SLAs, and experiments?
Detection without ownership is just a dashboard nobody acts on. Define the role matrix first.
- Data / analytics team: Owns instrumentation, baseline calculations, health score updates, and model maintenance. Responsible for alert accuracy and false positive rate.
- Customer success managers: Own outreach execution, check-in cadences, and playbook completion. Responsible for save rate and time-to-first-response.
- Account executives / Head of Revenue: Own escalation for red alerts on strategic accounts, renewal negotiations, and ROI QBR scheduling.
SLA targets:
- Yellow alert: CSM outreach initiated within 5 business days.
- Red alert: CSM and manager notified immediately; outreach within 24 hours.
- Strategic account red alert: AE looped in within 4 hours; executive outreach within 24 hours.
Experiment checklist to validate your signals
Before scaling your program, run at least one controlled experiment to confirm your signals actually predict churn and that your interventions actually save accounts.
- A/B test outreach cadence: Randomly assign flagged yellow accounts to "immediate outreach" vs. "delayed 10-day outreach." Measure save rate and churn rate at 60 days.
- Randomized intervention on flagged accounts: Hold out 20% of flagged accounts as a control group (no intervention). Compare churn rate to the 80% who received outreach. This gives you a clean save-rate lift number.
- Signal validation: For each signal in your health score, run a retrospective analysis: of accounts that churned in the past 12 months, what percentage tripped each signal 30+ days before cancellation? Signals with low historical recall should be reweighted or replaced.
Simple ROI calculation
Formula: (Retained MRR × probability uplift × average contract length in months) minus program cost.
Example: A SaaS book of business with $200,000 MRR at risk, a 15% probability uplift from the intervention program, and an average contract length of 12 months generates $360,000 in retained revenue. If the program costs $40,000 annually (analyst time + tooling), the net ROI is $320,000. Even conservative assumptions make the math compelling for most SMB SaaS teams. Pair this with a renewal rate improvement workflow to close the loop on escalated accounts.
Why a compact health score works better than tracking everything
The research case for the 5–7 metric health score is straightforward: focusing on a small set of core engagement metrics correlates better with account-level value delivery than tracking dozens of metrics without a unified strategy. Teams that track everything produce noisy alerts. Teams that track the right things produce saves.
The more counterintuitive finding is about which signals fire first. Conversational and relationship signals appear 60–90 days before cancellation, well before any usage metric degrades. Shorter email replies, a shift from collaborative to transactional tone, a champion who stops attending QBRs — these are the earliest detectable signals, and most analytics setups never capture them.
Champion departure is the single most overlooked signal in product analytics. It rarely appears in event logs. It requires a CRM field update, a process most teams run inconsistently. Yet an account that loses its internal champion without a replacement is at severe churn risk regardless of what the usage dashboard shows.
How to capture relationship and sentiment signals with low effort:
- Log champion role changes as a CRM workflow trigger. Any contact whose title or department changes should auto-flag the account for CSM review.
- Add a single-question check-in to your quarterly business review template: "On a scale of 1–5, how confident are you that [product] is delivering value to your team?" Responses below 3 fire a yellow alert.
- Use support ticket subject lines as a lightweight sentiment proxy. Tickets with subjects containing words like "cancel," "alternative," "export," or "contract" are high-signal and easy to flag with a keyword rule.
AI-powered conversation analysis can surface sentiment changes roughly 2–3 weeks earlier than traditional manual review. If you have the tooling, weight conversational sentiment at 10–15% of your composite score. If you do not, the single-question check-in cadence is a strong manual substitute.
Pro Tip: Weight champion status and conversational sentiment at a combined 20% of your health score even if your confidence in those data points is lower than your usage metrics. The earlier lead time more than compensates for the noisier signal.
Key Takeaways
Early churn detection works when you combine a compact 5–7 metric health score with relationship and sentiment signals that fire 60–90 days before cancellation, giving your team a real intervention window.
| Point | Details |
|---|---|
| Start with 5–7 metrics | A compact health score tied to value delivery outperforms tracking dozens of disconnected KPIs. |
| Relationship signals fire earliest | Champion departure and conversational tone shifts appear 60–90 days before cancellation, earlier than any usage metric. |
| Usage models reach 70–80% accuracy | Usage-based churn prediction at a 30-day horizon achieves 70–80% accuracy, while survey-based methods land around 50–60%. |
| Wire one alert and one check-in cadence | The fastest operational win is a single automated alert paired with a lightweight conversational check-in for yellow accounts. |
| Signalengine automates the full stack | Signalengine scores accounts automatically, fires alerts, and triggers outreach so your team acts on signals without digging through data. |
The gap between what churn prediction promises and what actually moves the needle
Most teams that build a churn dashboard expect results within 30 days. The realistic timeline for measurable save-rate improvement is 60–90 days from the first alert firing, and that assumes the outreach playbooks are already written and the CSM team is trained on them. Engineering and product teams will push back on instrumentation requests, especially for billing page events and CRM role-change triggers, because these feel like "sales problems." They are not. They are the highest-signal data points in your stack.
The political reality is that churn programs succeed when CSM, product, and sales share the same health score and the same escalation rules. When CSMs own the score but sales ignores it, strategic accounts churn without an AE ever knowing a signal fired. Align incentives by tying a portion of CSM variable compensation to save rate, not just renewal rate. Those are different metrics, and conflating them is one of the most common reasons churn programs stall.
One more thing most guides skip: the signals that map most directly to delivered account value are the ones worth weighting most heavily. If your product's core value is workflow automation, session depth and feature breadth matter more than login frequency. If your product's value is data access, export spikes are the most predictive signal you have. Calibrate your health score to your product's specific value delivery mechanism, not a generic template.
Signalengine catches churn signals before your team even notices them
Most SMB SaaS teams do not have a dedicated data analyst to build and maintain a churn detection stack. Signalengine fills that gap. It watches your customer behavior automatically, scores every account against the 5–7 metric health score framework described in this guide, and fires alerts the moment a threshold trips — without you building a single query.

The platform maps directly to the playbook above: composite health scoring, automated yellow and red alerts routed to the right team member, conversational signal ingestion, and outreach automation via email and SMS. You get the full detection-to-intervention loop in one dashboard, starting at $49/month.
If you want to see how it works against your own customer data, book a live demo or go straight to the churn prediction product page to see the feature set. Setup takes five minutes.
Useful sources
The research and references behind this guide, with notes on why each is worth reading:
- Amplitude — Customer Engagement Metrics — Authoritative guidance on event instrumentation and the case for a compact, value-tied metric set over a sprawling KPI list.
- Twilio — 9 Metrics and KPIs for Customer Engagement: Practical overview of engagement KPIs across touchpoints; useful for teams building their first measurement framework.
- Signalengine — How to Detect B2B Customer Churn Before It Happens: Practical instrumentation guidance and churn detection approaches for B2B SaaS teams.
- Signalengine — The 7 Churn Signals Every SaaS Founder Ignores: A concise signal list with examples; useful as a quick-reference companion to this guide.
FAQ
What is a churn signal?
A churn signal is a leading behavioral or relational indicator that predicts cancellation before it happens, typically 30–90 days in advance. Examples include login frequency drops, feature breadth contraction, billing page visits, and champion departure.
How do you track churn rate?
Divide the number of customers lost during a period by the total customers at the start of that period. Track both logo churn (account count) and revenue churn (MRR lost) separately, since a small number of large accounts can mask a high logo churn rate.
What are the leading indicators of churn?
The six most predictive leading indicators are login frequency drop, feature breadth contraction, export or download spikes, billing page visits, support ticket sentiment shifts, and team seat reduction. Conversational tone changes and champion departure often fire even earlier, at 60–90 days before cancellation.
What tools automatically alert you when usage patterns indicate churn risk?
Platforms like Signalengine score customer behavior automatically and fire alerts when accounts cross yellow or red thresholds, covering the full detection-to-outreach loop without manual data pulls. You can also configure threshold-based alerts in BI tools like Looker or Metabase if you have a data analyst to maintain them.
How do you reduce churn once a signal fires?
Match the intervention to the specific signal: a login drop warrants a personalized CSM check-in within 7 days; a billing page visit spike warrants a proactive plan review the same business day; a champion departure warrants executive outreach within 24 hours. Intervening during the 4–12 week decay phase can recover 30–50% of at-risk accounts.
Ready to Stop the Revenue Leak?
Signal Engine gives small and local businesses 31 AI-powered tools to score leads by buying intent, predict churn before it happens, auto-generate email and SMS campaigns, and recover missed calls automatically — all in one dashboard starting at $49/month.
Start your free 7-day trial — no credit card required. Setup takes 5 minutes.