
TL;DR:
- Revenue recovery reports systematically reconcile operational and financial data to identify and prioritize revenue discrepancies. They enable continuous, real-time detection and resolution of claims, feeding back patterns to prevent future leakage. Cross-functional workflows and AI-driven automation significantly enhance recovery rates and overall revenue assurance.
Revenue recovery reports are specialized financial tools that expose and track lost or at-risk revenue by reconciling operational and financial data to enable systematic recovery efforts. Finance professionals in ecommerce, SaaS, and medical billing rely on these reports to identify billing discrepancies, validate claims, and close revenue gaps before they compound. Understanding how revenue recovery reports work is the difference between reacting to lost income and preventing it. This guide breaks down the mechanics, structure, prioritization logic, and continuous improvement role these reports serve for analysts managing complex revenue cycles.
How revenue recovery reports work: data sources and discrepancies
Revenue recovery reports function through discrepancy reconciliation, comparing what should have been collected against what was actually received. The gap between those two figures is where lost revenue lives. Every effective report starts by pulling from two parallel data streams: operational records and financial records.
Operational data sources typically include:
- Shipment confirmations and delivery records (ecommerce)
- Subscription activations, upgrades, and cancellations (SaaS)
- Service utilization logs and procedure codes (medical billing)
- Contract terms, pricing schedules, and renewal dates
Financial data sources include:
- Invoices and purchase orders
- Remittance advices and payment confirmations
- Explanation of Benefits (EOB) documents in healthcare
- Bank statements and ledger entries
Once these data streams are matched, the report surfaces discrepancy categories. Common types include billing errors, deductive mismatches, underpayments, missed charges, and denied claims. In ecommerce, this often means carrier billing disputes where shipment data contradicts what a retailer deducted. In medical billing, denied or underpaid claims represent the primary discrepancy type, with structured appeals workflows recovering 10 to 30% of revenue within 60 to 120 days. That range is significant. It means a $1 million annual revenue cycle could have $100,000 to $300,000 sitting in recoverable claims at any given time.
For SaaS businesses, the trigger is different. Real-time payment lifecycle events like "payment.failed` feed directly into recovery reports, flagging involuntary churn before it becomes permanent. The report then tracks retry schedules and dunning status alongside financial outcomes.
How are revenue recovery reports structured and presented?
The structure of a recovery report determines whether an analyst can act on it or just read it. Well-designed reports separate open claims from closed claims, giving teams a live view of what still requires action versus what has been resolved.

Open vs. closed claim dashboards
Oracle's Channel Revenue Management Command Center is a widely referenced example of enterprise-level recovery reporting. It provides drilldown views by customer, discrepancy type, denial reason, claim age, and assigned personnel. This level of granularity lets analysts move from a summary view to a specific transaction in seconds, which matters when managing hundreds of open claims simultaneously.
Financial aggregation tables are the second structural layer. Tools like NetSuite surface billed, deferred, and recognized revenue by customer and transaction, allowing analysts to reconcile what the income statement shows against what was actually collected. This is where revenue recognition gaps become visible.
| Report component | Function |
|---|---|
| Open claims dashboard | Tracks unresolved discrepancies with status, age, and assigned owner |
| Closed claims report | Documents resolved cases for audit trail and pattern analysis |
| Financial aggregation table | Reconciles billed, recognized, and deferred revenue by period |
| Drilldown view | Isolates individual transactions by customer, type, or denial reason |
| Escalation timeline tracker | Flags claims approaching appeal or dispute deadlines |
Pro Tip: Set your open claims dashboard to sort by claim age descending, not by dollar value. The largest claims are rarely the ones closest to expiring. Missing a $4,000 appeal deadline because you were focused on a $40,000 claim that still has 90 days left is a recoverable mistake that happens constantly.
Visualization matters as much as data accuracy. Recovery workflow progress, deadline proximity, and claim status changes should be visible at a glance. Platforms like Waystar automate post-payment recoupment matching to under one minute per adjustment, replacing the fragmented manual reconciliation that slows most teams down.
What prioritization strategies do recovery reports support?
A recovery report without a prioritization framework is just a list of problems. The reports that drive real financial outcomes connect discrepancy data to ranked recovery actions based on deadline proximity, dollar value, and recovery probability.
Age-bucket analysis is the foundation. Claims are grouped by how long they have been open, typically in 30, 60, 90, and 120-plus day buckets. Each bucket carries different urgency because appeal windows and dispute deadlines are contractually fixed. Delayed escalation of payor disputes can extend recovery timelines by years, and in some cases, missed deadlines mean forfeited claims with no path to recovery.
Effective prioritization integrates four scoring factors:
- Dollar value: Higher-value claims justify more analyst time and legal resources
- Payer or customer history: Repeat offenders with known denial patterns get escalated faster
- Denial reason: Coding errors are faster to correct than contract underpayments, which may require renegotiation
- Deadline proximity: Claims within 15 days of an appeal window get immediate attention regardless of value
Root cause breakdown is the second layer. A recovery report that shows 200 denied claims is less useful than one that shows 140 denials from coding errors, 45 from contract underpayments, and 15 from missing documentation. Each root cause maps to a different resolution workflow. Coding errors go to the billing team. Contract underpayments go to finance and legal. Missing documentation goes back to operations.
For SaaS teams, retry schedules with exponential backoff at 3, 7, and 17 days are built directly into recovery reporting logic. The report tracks which failed payments recovered through automated retry versus which required manual outreach, giving teams data to refine their dunning sequences over time.
Pro Tip: Build a secondary sort column in your prioritization view that flags claims where the denial reason has appeared more than three times in the last 90 days. Those are systemic issues, not one-off errors. Fixing the upstream process recovers more revenue than working each claim individually.
Detecting lost revenue metrics at the root cause level is what separates a reactive recovery operation from a proactive one.
How do recovery reports fit into continuous revenue assurance?
Revenue recovery reporting is more effective as a continuous, system-driven lifecycle embedded in contract-to-cash processes than as a periodic audit. One-time audits find problems after the fact. Continuous reconciliation catches discrepancies as they occur, when they are still within appeal windows and before they compound.
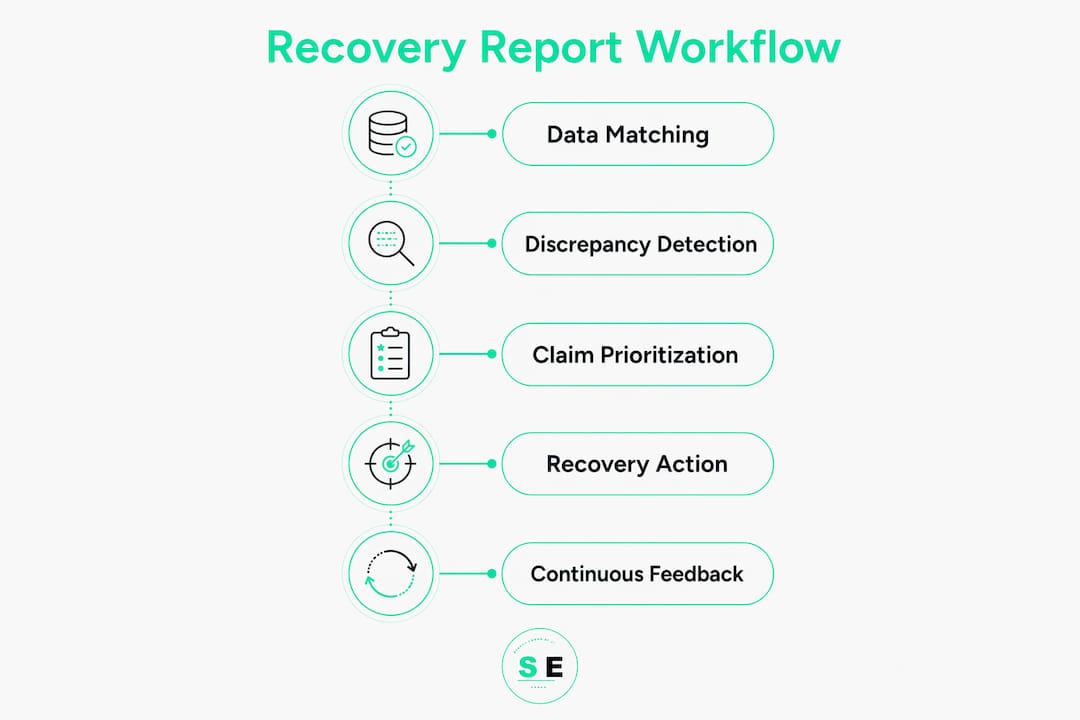
Here is how continuous recovery reporting creates a feedback loop that prevents future leakage:
- Reconciliation flags a discrepancy at the transaction level, triggering an open claim in the dashboard.
- Root cause is classified by the system or analyst, linking the discrepancy to a specific billing code, contract term, or payment failure type.
- Recovery action is taken through the appropriate workflow: appeal submission, retry logic, or dispute escalation.
- Pattern data is fed back to front-end billing, coding, and contract management teams to prevent recurrence.
- Contract renegotiation is informed by underpayment pattern data, giving finance teams documented evidence for rate discussions with payers or customers.
The feedback loop in step four is where most organizations leave money on the table. They recover the individual claim but never fix the process that created it. A revenue leakage audit that runs continuously catches these patterns in weeks rather than quarters.
For SaaS businesses, continuous reporting also reduces involuntary churn. A failed payment that gets retried and recovered within 17 days does not become a churned customer. The recovery report tracks that outcome and attributes it to the dunning workflow, giving teams a clear ROI figure for their retention investment. Integrating legal and operational timelines into the same reporting view is equally important for healthcare and enterprise contexts, where coordinated dispute escalation shortens cash realization timing significantly.
Key takeaways
Revenue recovery reports work by systematically reconciling operational and financial data, classifying discrepancies by root cause, and routing each claim through a prioritized workflow with deadline-aware escalation logic.
| Point | Details |
|---|---|
| Core mechanism | Reports reconcile operational and financial data to surface and validate revenue discrepancies. |
| Report structure | Open and closed claim dashboards with drilldown by type, age, and reason drive analyst efficiency. |
| Prioritization logic | Age-bucket analysis combined with root cause classification determines which claims get worked first. |
| Continuous vs. periodic | System-driven continuous reconciliation catches discrepancies faster than one-time audits. |
| Feedback loop value | Pattern data from recovery reports should feed back to billing, coding, and contract teams to prevent recurrence. |
Why most recovery reports fail to deliver their full potential
Here is what I have seen repeatedly working with finance teams across SaaS and healthcare: the report exists, the data is there, and the claims are logged. But the team is still leaving 20 to 40% of recoverable revenue on the table. The problem is almost never the data. It is the workflow design around the data.
The most common failure is relying on high-level metrics like net collection ratio or gross recovery rate without mapping those numbers to specific root causes and assigned owners. A 94% collection rate sounds strong until you realize the 6% gap is concentrated in one payer category with a 30-day appeal window that expires next week. High-level metrics without root cause mapping do not support claim closure. They support reporting to leadership.
The second failure is treating recovery as a finance-only function. The most effective recovery operations I have seen pull in legal for escalation timing, operations for documentation gaps, and product or billing teams for coding corrections. Cross-functional ownership is not a nice-to-have. It is what separates a 15% recovery rate from a 28% one.
The future of this space is real-time reporting with predictive flagging. AI tools that score claims by recovery probability before an analyst touches them are already available. The teams adopting them now are building a structural advantage that compounds over time. If your current recovery report requires manual sorting to find the highest-priority claims, that is the first thing to fix.
— Bernard
How Signalengine supports your revenue recovery workflow
Finance teams and analysts need more than a static report. They need a system that detects discrepancies, scores them by recovery priority, and triggers the right workflow automatically.

Signalengine's AI-powered platform does exactly that. It aggregates your financial and operational data, flags revenue leakage in real time, and scores each gap by recovery potential so your team works the highest-value items first. The free revenue leakage audit gives you a clear picture of where your pipeline is draining within minutes, no lengthy onboarding required. SaaS teams can explore the dedicated SaaS recovery tools built specifically for dunning automation and payment lifecycle tracking. Watch the live platform demo to see how the dashboard turns recovery data into closed claims. ⚡
Ready to Stop the Revenue Leak?
Signal Engine gives small and local businesses 31 AI-powered tools to score leads by buying intent, predict churn before it happens, auto-generate email and SMS campaigns, and recover missed calls automatically — all in one dashboard starting at $49/month.
Start your free 7-day trial — no credit card required. Setup takes 5 minutes.
FAQ
What is the core function of a revenue recovery report?
A revenue recovery report reconciles operational data (shipments, subscriptions, service records) against financial data (invoices, payments, remittances) to identify discrepancies and track resolution workflows from identification through claim closure.
How do you read a revenue recovery report effectively?
Start with the open claims dashboard sorted by age bucket, then filter by root cause category to identify systemic issues. Dollar value matters, but deadline proximity determines which claims require immediate action.
What metrics should a revenue recovery report include?
Effective reports track claim age, denial reason, dollar value, recovery status, and escalation deadline. High-level metrics like net collection ratio are useful for executive reporting but insufficient for managing individual claim resolution.
How does continuous recovery reporting differ from a one-time audit?
Continuous reporting flags discrepancies as they occur within live contract-to-cash workflows, keeping claims inside appeal windows. A periodic audit finds problems after the fact, often after recovery windows have closed.
How does automation improve the revenue recovery reporting process?
Automated reconciliation tools like Waystar reduce post-payment adjustment processing to under one minute per transaction. For SaaS, automated retry logic at 3, 7, and 17-day intervals recovers failed payments without manual intervention, directly reducing involuntary churn.