

The pipeline coverage ratio is your total qualifying pipeline value divided by your revenue target for the period. As a rule of thumb, derive your target from the inverse of your win rate instead of borrowing a generic 3x. If your coverage falls short of that number, you need more pipeline. If it's high but deals keep slipping, you have a quality problem, not a quantity one.
TL;DR:
- Rely on your own historical win rate to determine your pipeline coverage target, rather than using a generic 3x multiplier.
- Regularly audit pipeline probabilities against actual outcomes, especially for deals in later stages, to avoid inflated or inaccurate coverage estimates.
- Clean your pipeline data weekly by flagging deals with outdated close dates or no recent activity, as stale deals can significantly distort coverage calculations.
- Use stage-adjusted coverage for precise forecasting and quarterly targets, since it accounts for real historical win rates per stage, reducing optimism bias.
- Adjust your coverage goals based on your sales cycle length, current win rate, and expected pipeline slippage to ensure realistic target setting.
Table of Contents
- What Is Pipeline Coverage and How Do You Calculate It?
- Why Stage-Adjusted Coverage Beats Guessed Probabilities
- How Much Pipeline Coverage Do You Actually Need?
- What Should Count as Qualified Pipeline?
- How Do You Fix Low or Misleading Pipeline Coverage?
- Common Pipeline Coverage Mistakes to Avoid
- How Often Should You Review Pipeline Coverage?
- The Coverage Number Everyone Trusts Too Much
- Fix Pipeline Blind Spots Before They Cost You the Quarter
- Sources
- FAQ
- Ready to Stop the Revenue Leak?
What Is Pipeline Coverage and How Do You Calculate It?
Pipeline coverage answers one question: do you have enough open opportunity to hit the number? The core formula is simple: open pipeline value for the period divided by your revenue target for that same period.
That raw number is only step one. Three calculations exist, and each answers a slightly different question.
- Raw coverage. Add up every open deal's full value scheduled to close in the period, then divide by target. Say you have $1.8 million in open deals against a $500,000 target. That's 3.6x raw coverage. It's a fast gut check, but it treats a deal at 10% probability the same as one at 90%.
- Weighted coverage. Multiply each deal's value by its assigned close probability, then sum and divide by target. If your $1.8 million in deals averages a 35% blended probability, weighted pipeline value is $630,000, or 1.26x coverage against that same $500,000 target. That's a very different picture than the raw 3.6x suggested.
- Stage-adjusted coverage. Instead of relying on whatever probability a rep typed into the CRM, apply your team's actual historical win rate for each stage. If deals in "proposal sent" close 40% of the time historically, every deal in that stage gets a 40% multiplier, regardless of what the rep guessed.
Use raw coverage for a quick pulse check on supply. Use weighted coverage when you need a working forecast number for the week. Use stage-adjusted coverage when you're setting quarterly targets or defending a number to your CFO, because it strips out rep optimism bias.
Why Stage-Adjusted Coverage Beats Guessed Probabilities
Raw coverage lies to you in a specific way: it can't tell the difference between a deal that closes next week and one that's been sitting in "discovery" for four months with no next step.
The fix is auditing your probabilities against what actually happened. Pull every deal that closed or died last quarter, group by the stage it was in 30 days before that outcome, and calculate the real close rate per stage. Compare that to whatever probability your CRM has assigned by default.
Sample size matters here. If you only closed eight deals from a given stage last quarter, that win rate isn't statistically reliable yet. When stage-level history is thin, fall back to weighted coverage with corrected probabilities rather than trusting a stage-adjusted number built on a handful of data points.
A few checks catch probability inflation fast:
- Deals sitting at 70%+ probability with no activity logged in 14 days.
- Reps whose average deal probability is consistently 15+ points above team average.
- Stages where the "next step" field has been blank for more than a week.
Pro Tip: Run this audit quarterly, not annually. Win rates drift as your product, pricing, and competitive landscape shift, and a stale probability model quietly wrecks your coverage math.
How Much Pipeline Coverage Do You Actually Need?
Skip the generic multiplier. Your coverage target should come from your own numbers, not a vendor's slide deck.
- Find your baseline. Take your team's historical close rate for qualified opportunities over the last two to four quarters. If you close 25% of qualified deals, your baseline coverage need is 1 ÷ 0.25, or 4x.
- Add a slippage buffer. Deals that were supposed to close this quarter but pushed to next quarter aren't losses, but they still blow a hole in your current-period number. If historically 20% of your "closing this quarter" pipeline slides to the next period, inflate your target by roughly that same percentage.
- Adjust for cycle length. A 45-day sales cycle needs less lead time built into coverage math than a 9-month enterprise cycle. Longer cycles mean today's pipeline shortfall shows up as a missed number two quarters from now, not next month.
- Check the benchmark against your own math. The commonly cited 3x to 5x range only applies when your win rate sits between 20% and 33%. If your team closes at 15%, you need closer to 6.5x, and no vendor benchmark will tell you that.
What Should Count as Qualified Pipeline?
Coverage math is only honest if the pipeline feeding it is real. A deal belongs in your coverage calculation when it has a defined next step, a close date that actually falls inside the period you're measuring, confirmed budget or fit, and a legitimate expansion or new-logo motion behind it.
Deals that should never make the cut: anything with a close date that's already passed and hasn't been updated, single-touch "just sending pricing" inquiries with no follow-up scheduled, duplicate opportunities created by rep error, and anything with zero logged activity in 30-plus days.
A short weekly hygiene pass keeps this honest:
- Flag every deal with a close date in the past.
- Flag every deal with no activity logged in the last two weeks.
- Confirm every deal above a set dollar threshold has a named next step.
- Spot-check for duplicate opportunities tied to the same account.
Reconciling gross to qualified pipeline usually stings the first time you run it. Cleaning stale and misdated deals commonly cuts gross CRM pipeline by a meaningful chunk before you even get to a real coverage number.
Pro Tip: Assign hygiene ownership by name, not by team. "Sales ops will review pipeline" gets ignored. "Maria reviews every deal over $10,000 every Monday at 9am" gets done.
How Do You Fix Low or Misleading Pipeline Coverage?
Coverage problems split into two categories: not enough pipeline, or pipeline that looks fine but won't convert. The fix depends on which one you're facing, and the timeline for each fix looks different too.
- Short-term plays (this week, this month). Push an executive-backed campaign on your top 10 stalled deals. Run a targeted SDR sprint into a specific segment. Consider selective, time-boxed discounting on deals already in late stage rather than broad-based cuts.
- Medium-term plays (this quarter). Tighten qualification criteria at the top of funnel so weak deals stop clogging the pipeline in the first place. Rebalance territories if one rep is drowning in volume while another sits idle. Launch a focused demand campaign into your best-performing segment or source, informed by a pipeline gap analysis.
- Long-term plays (next two quarters and beyond). Decide whether the answer is hiring more reps or fixing pipeline creation per rep. Tie headcount planning directly to coverage math: if you need 5x coverage to hit a growing target and current reps can't generate that volume, that's a hiring case, not a motivation problem.
The decision guide is straightforward: if coverage is consistently thin across every segment, hire or fix top-of-funnel generation. If coverage looks fine in aggregate but one segment or source is chronically short, fix that source mix before you touch headcount. If coverage swings wildly month to month, the real issue is probably forecasting discipline, not pipeline volume. Tools like LeadPilot's prospecting stack can help fill top-of-funnel gaps quickly when the short-term play is pure volume.
Common Pipeline Coverage Mistakes to Avoid
Most bad coverage numbers trace back to the same handful of errors, and they compound quietly until a quarter blows up.
- Wrong close dates. A deal with a close date from two months ago still counts toward "this quarter" if nobody updates the field. Enforce a period-scoped filter and reject any close date outside the current window from your coverage math.
- Stale deals inflating the count. A deal with no activity in 45 days isn't pipeline, it's a ghost. Set an activity threshold and auto-flag anything past it.
- Aggregate numbers hiding segment shortfalls. Company-wide coverage of 4x can mask one segment sitting at 1.5x while another carries 8x. Always check coverage by segment, not just in total.
- Uncalibrated probabilities. If nobody has checked whether "50% probability" actually means 50% in six months, your weighted number is fiction. Run periodic calibration sessions where managers compare assigned probabilities against real outcomes.
How Often Should You Review Pipeline Coverage?
Cadence matters as much as calculation. Check current-quarter coverage weekly, since risk compounds fast when a deal slips or dies close to period end. Review trend lines monthly, comparing this month's coverage to the prior three. Reset targets quarterly using fresh win-rate data.
Your dashboard should show raw, weighted, and stage-adjusted views side by side rather than picking one, because raw shows gross supply while weighted shows expected value, and you need both to make a good call. Add deal aging, source split, and concentration risk (how much of total value sits in your five biggest deals) to the same view.
Set alert thresholds that trigger automatically:
- Coverage drops more than 15% week over week.
- Stale-deal count exceeds a fixed threshold for your team size.
- Any single deal represents more than 20% of total pipeline value.
Weekly manager routines should focus on close-date migration, not just deal count. Watching how many deals moved their close date last week predicts forecast volatility better than almost any other single metric.
The Coverage Number Everyone Trusts Too Much
Here's what most sales leaders get backward: they treat pipeline coverage as a forecasting tool when it's really a diagnostic one. It tells you whether you have enough raw material to possibly hit it, assuming your probabilities are honest and your close dates are real. Those are two very big assumptions that most CRMs never force anyone to check.
The uncomfortable truth is that most coverage problems aren't pipeline problems at all. They're data integrity problems wearing a pipeline costume.
The teams that get this right stop asking "what's our coverage" and start asking "what's our coverage after we remove every deal that shouldn't be there." That second number is smaller, less flattering, and far more useful. Automated hygiene checks and stale-deal flags exist precisely because manual review catches maybe half the problem before a rep quietly re-dates a deal for the third time.
— Bernard
Fix Pipeline Blind Spots Before They Cost You the Quarter
Manual coverage audits catch problems after they've already cost you a week or two of clean forecasting. Signal Engine's pipeline analytics run the stale-deal flags, probability audits, and segment-level coverage checks described above automatically, so you're not rebuilding a spreadsheet every Monday morning to find out which deals are lying to you.

The platform's revenue intelligence tools for small business score deals by real buying intent instead of a rep's optimism, and flag churn risk before it shows up as a lost renewal in next quarter's coverage math. If you're spending more time cleaning your CRM than coaching your reps, that's the actual problem this fixes. Check current pricing, which starts at $49/month with a free tier to test the coverage and hygiene tools against your own pipeline before committing to anything.
Sources
For deeper technical detail beyond this guide, these sources go further on specific pieces:
- Pipeline Coverage Ratio: How Much Pipeline Do You Need? - Rework Resources
- How to Calculate Pipeline Coverage Ratio (With Real Benchmarks) | ORM
- Pipeline coverage guide: formula and benchmarks - MetricKit Tools
FAQ
How Do You Calculate Pipeline Coverage?
Divide your total qualifying open pipeline value for the period by your revenue target for that same period. For a more accurate number, use weighted or stage-adjusted coverage instead of raw deal value, since those account for actual close probability.
What Is a Good Pipeline Coverage Ratio?
There's no universal good number. A ratio that works is one derived from your own win rate using 1 ÷ win rate, plus a buffer for slippage.
What Does 3x Pipeline Coverage Mean?
This may be adequate only if your team closes about a third of qualified opportunities; teams with lower win rates generally require higher coverage to hit the same target.
Do I Need Different Coverage Targets for Different Segments?
Yes. One company-wide coverage number often hides segment-level shortfalls, since win rates, deal sizes, and cycle lengths usually differ by segment, source, and rep. Calculate coverage separately for each and watch for any segment running thinner than the aggregate suggests.
Ready to Stop the Revenue Leak?
Signal Engine gives small and local businesses 31 AI-powered tools to score leads by buying intent, predict churn before it happens, auto-generate email and SMS campaigns, and recover missed calls automatically — all in one dashboard starting at $49/month.
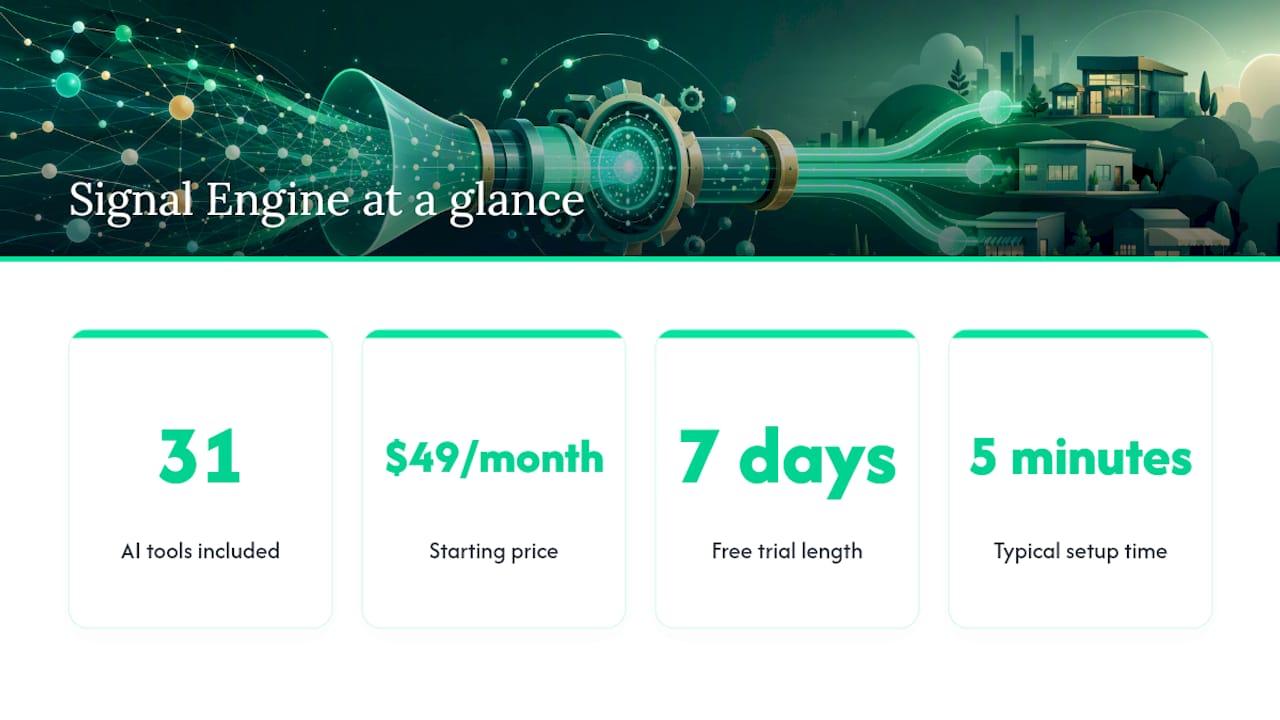
Start your free 7-day trial — no credit card required. Setup takes 5 minutes.