

Prospect engagement scoring is a system that assigns numeric values to a prospect's behaviors, like opening an email, visiting a pricing page, or requesting a demo, so sales and marketing teams know exactly who to contact first. The immediate action for most teams: map your top three high-intent signals (demo requests, pricing page visits, and repeat site sessions) into a simple weighted point pilot before you touch anything else. Industry benchmarks put social engagement rates in the 1% to 5% range, and teams that track engagement metrics systematically report roughly 28% higher quota attainment and 19% faster sales cycles. Organizations running advanced scoring setups have seen MQL to SQL conversion climb by 30% to 40% once weighting and decay are dialed in correctly.
That's the short version. The rest of this guide walks through how the scoring actually works, what signals belong in it, and how to build a model your sales team will trust enough to act on.
Key Takeaways
Prospect engagement scoring works when weighted point values, recency decay, and clear thresholds combine into a routing system that sales trusts and acts on quickly.
| Point | Details |
|---|---|
| Weight by intent, not effort | Give explicit signals like demo requests far more points than passive ones like blog reads. |
| Apply recency decay | Use a multiplier so actions from weeks ago count less than actions from today. |
| Calibrate thresholds to capacity | Set sales-ready cutoffs based on conversion data and what your SDR team can realistically handle. |
| Govern the model actively | Document weight changes, check signal health weekly, and retrain quarterly to prevent decay. |
| Automate the scoring, keep judgment for edge cases | Tools like Signal Engine handle scoring and routing automatically, while high-value or ambiguous accounts still warrant human review. |
Table of Contents
- What Is Prospect Engagement Scoring and How Does It Differ From Lead Scoring?
- Which Behavioral Signals Actually Predict Buying Intent?
- How Are Prospect Engagement Scores Calculated?
- How Do You Set Score Thresholds and Automate Sales Handoffs?
- What Do You Need in Place Before You Launch Engagement Scoring?
- What Do Sample Engagement Scoring Models Look Like?
- How Do You Measure and Refine Your Scoring Model?
- What Goes Wrong With Engagement Scoring, and How Do You Prevent It?
- How Signal Engine Applies Engagement Scoring in Practice
- When Should You Trust the Algorithm, and When Should a Human Step In?
- Ready to Run Engagement Scoring Without Building It From Scratch
- Ready to Stop the Revenue Leak?
- Sources
- FAQ
What Is Prospect Engagement Scoring and How Does It Differ From Lead Scoring?
Engagement scoring measures what a prospect does. Lead scoring, in its traditional form, measures who a prospect is. That distinction sounds small until you watch two very different prospects land the same lead score because they share a job title and company size, even though one has visited your pricing page five times this week and the other hasn't opened an email since a trade show booth six months ago.
Traditional lead scoring blends firmographic fit (industry, company size, title, budget signals) with a handful of behavioral checkboxes. It answers "does this account match our ideal customer profile?" Engagement scoring answers a different question entirely: "is this specific person showing buying momentum right now?" You need both. A perfect-fit account that never engages is dead weight in your pipeline. A wildly engaged prospect from outside your target market is a distraction, not a deal.
Here's where each approach earns its keep:
- Sales handoff decisions rely on combined fit plus engagement. A high-fit, high-engagement account should hit a rep's desk immediately.
- Campaign optimization leans almost entirely on engagement data. You're testing which content and channels actually move people, regardless of firmographic fit.
- Content ROI measurement is pure engagement scoring. Fit doesn't tell you whether your latest case study is pulling its weight.
Think of it as two layers stacked on top of each other. The bottom layer is fit, usually owned by marketing ops or RevOps, built once and updated quarterly. The top layer is engagement, owned jointly by demand generation and sales development, and it needs to move in near real time because behavior changes fast. A prospect who was cold on Monday can request a demo by Thursday, and your scoring system has to catch that shift within hours, not weeks.
Pro Tip: Don't merge fit and engagement into a single blended number if you can avoid it. Keep them as two separate scores that combine into a routing decision. It's far easier to diagnose a broken model when you can see whether the fit layer or the engagement layer caused a bad handoff.
Which Behavioral Signals Actually Predict Buying Intent?
Not every click deserves a point. This is where most homegrown scoring models fall apart: teams award equal weight to a blog read and a pricing page visit, and the resulting scores end up meaningless.

Signals break into three tiers. Explicit intent signals are the prospect telling you, directly, that they're evaluating a purchase: demo requests, pricing page visits, "contact sales" form fills, free trial signups. These deserve the heaviest weighting because they require deliberate effort. Nobody accidentally requests a demo.
High-engagement behaviors sit a notch below that. Repeat website visits within a short window, multiple email clicks on the same campaign, webinar attendance with active participation (not just registration), and case study downloads all show real interest without the explicit "I want to buy" signal. These deserve moderate points, and they're often the best predictor of timing, even when they don't predict intent as clearly as a demo request does.
Low-value or vanity signals are the ones to treat with caution: a single email open, a newsletter subscription, a social media follow. Email opens in particular have degraded significantly as a reliable signal, thanks to Apple's Mail Privacy Protection and similar tools that auto-open messages regardless of whether a human ever saw them. Counting opens the same way you counted them five years ago will quietly poison your scoring model.
Channel matters here too. A click from a paid social ad carries less signal than an organic return visit to your website, because the paid click required almost no effort. A phone call inbound to your sales line, even a short one, usually outweighs a dozen email opens combined. Event attendance splits the difference: showing up to a webinar is medium value, but staying for the Q&A and asking a question is a much stronger tell.
Engagement metrics are leading indicators that point to intent and timing, not proof of intent on their own. The mistake most teams make is optimizing a single metric in isolation instead of watching whether it actually correlates with meetings booked and deals closed.
That's the discipline that separates a scoring model that works from one that just looks sophisticated in a dashboard.
How Are Prospect Engagement Scores Calculated?
The most common architecture combines three variables: a base weight for the action, a frequency modifier, and a recency decay factor. In plain terms, a score equals (action weight) multiplied by (how often it happens, capped) multiplied by (how recently it happened). This four-layer structure, moving from behavior taxonomy to weight assignment to score calculation to threshold routing, is the backbone of most functioning engagement scoring systems, whether they run in a dedicated platform or a spreadsheet.
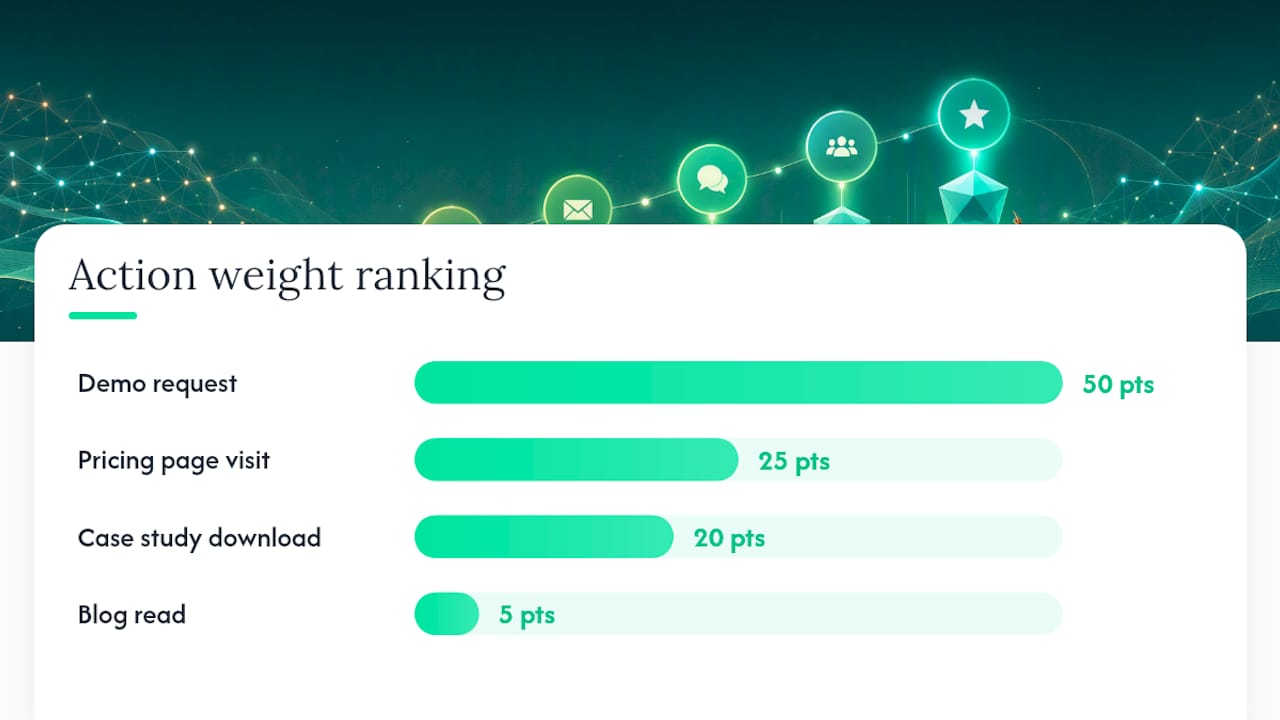
A concrete example makes this less abstract. Say a demo request carries a base weight of 50 points, a pricing page visit carries 25, a case study download carries 20, and a blog read carries 5. A prospect who requested a demo three weeks ago and read two blog posts yesterday isn't necessarily "hotter" than one who visited pricing last night, because recency decay adjusts the older action downward. A common approach applies an exponential decay multiplier, something like 1.0 for actions in the last 7 days, 0.7 for 8 to 30 days, 0.4 for 31 to 90 days, and 0.1 beyond that. The demo request from three weeks ago still carries weight (50 × 0.7 = 35), but it no longer dominates the score the way it did the day it happened.
Four rules keep this from becoming chaos:
- Positive and negative points both matter. Unsubscribing, marking an email as spam, or requesting removal from a list should subtract points, sometimes enough to zero out a score entirely.
- Cap repeatable actions. Five blog reads in one day shouldn't equal one demo request. Set a daily or weekly ceiling per action type.
- Deduplicate across channels. If a prospect clicks the same email link on desktop and mobile, that's one action, not two.
- Decide who owns exceptions. Someone needs authority to override the model when a signal clearly misfires, like a bot crawling your pricing page a hundred times in a minute.
Keep the whole model in a document sales can actually read: what earns points, what loses them, and why. If your SDR team can't explain in one sentence why a lead scored 87, the model has already lost their trust, and they'll go back to gut instinct.
How Do You Set Score Thresholds and Automate Sales Handoffs?
Thresholds should reflect what your data says about conversion, not a round number that felt right in a meeting. If prospects who cross 75 points convert to opportunities at three times the rate of those who don't, 75 is your line, not 100 because it's a cleaner number.
A common three-tier structure looks like this:
| Score Range | Lifecycle Stage | Typical Action |
|---|---|---|
| 0–49 | Nurture | Add to a general nurture sequence, low-touch content cadence |
| 50–99 | Accelerated nurture | Trigger targeted content, alert marketing for a personalized touch |
| 100+ | Sales-ready (SQL) | Route to an SDR immediately, log a same-day outreach task |
Calibrate the ceiling of each band to your team's actual capacity. If your SDRs can realistically work 40 sales-ready leads a week and your current threshold generates 200, the threshold is set too low, not your team too slow. Widen the gap or raise the bar until volume matches capacity.
Automation should trigger three kinds of actions once a prospect crosses a threshold: routing to the right rep or queue based on territory or account ownership, enrolling in a specific nurture track matched to their score band, or firing an immediate task for human outreach when the score spikes past your top threshold. None of this requires exotic tooling, just clear rules and a system that watches scores continuously rather than in a weekly batch job.
Before you trust any of it, back test. Pull six months of closed deals, run your proposed scoring model against their historical behavior, and check whether the model would have flagged them as sales-ready before they actually converted. Then set a service level agreement for response time. Speed to first contact is one of the strongest predictors of whether a sales-ready lead actually converts, so a threshold system that routes leads correctly but sits in a queue for three days has already failed.
What Do You Need in Place Before You Launch Engagement Scoring?
A scoring model is only as good as the data feeding it. Before you build anything, confirm you have these pieces working:
- CRM contact and company records that are reasonably clean, with duplicate accounts merged and basic fields populated.
- Web analytics tracking on every page you plan to score, including pricing, demo request, and case study pages.
- Email engagement data from your sending platform, with an honest accounting of which opens are bot-inflated.
- Event attendance logs, whether that's webinars, trade shows, or in-person demos.
- Call logs, ideally with duration and outcome, not just a record that a call happened.
- An intent or enrichment feed, if your budget allows one, to catch research happening off your own domain.
Getting these systems to agree on identity is the hardest part. Account-level identification resolves roughly 93% of engaged sessions, but person-level identification, tying a session to a specific name, email, and title, only resolves about 62% in some traffic profiles. That gap matters enormously for scoring, because a score attached to an anonymous session is nearly useless for outreach. You can flag account-level surges, but you can't call someone whose name you don't have.
Map out which system owns which identifier before launch: email address usually anchors CRM and marketing automation, cookies anchor web analytics, IP address anchors account-level firmographic matching, and single sign-on tokens anchor any logged-in product usage. Wherever two systems don't share a common key, you'll get double counting or silent gaps, and neither shows up until someone asks why a known customer suddenly scored zero for a month.
Assign real ownership. Someone in RevOps or marketing ops should own model design and weight changes. Someone in sales ops or data should own QA and check score distributions weekly for anomalies. Someone in sales leadership should own SLA monitoring for handoff speed. And someone, anyone, should own documentation, because a model with no written history of weight changes becomes impossible to debug six months later. Before you go live, run a small sampling test: pull twenty recent "engaged" records and manually verify the tracking actually fired correctly and the identity resolved to a real, named contact. If more than a couple fail that check, fix data plumbing before you trust a single point value.
What Do Sample Engagement Scoring Models Look Like?
Numbers land better than theory. Here are two working models, one for a B2B SaaS company selling a mid-market product, and one for a local services business like an HVAC or dental practice.
B2B SaaS model:
| Signal | Base Points | Recency Multiplier (0–7 / 8–30 / 31+ days) |
|---|---|---|
| Demo request | 50 | 1.0 / 0.8 / 0.5 |
| Pricing page visit | 25 | 1.0 / 0.7 / 0.4 |
| Case study download | 20 | 1.0 / 0.7 / 0.4 |
| Repeat site visit (3+ in 7 days) | 15 | 1.0 / 0.6 / 0.3 |
| Webinar attendance (full session) | 15 | 1.0 / 0.7 / 0.4 |
| Blog read | 5 | 1.0 / 0.5 / 0.2 |
| Unsubscribe / spam complaint | -30 | Applied immediately, no decay |
Local services model (HVAC or dental example):
| Signal | Base Points | Recency Multiplier (0–3 / 4–14 / 15+ days) |
|---|---|---|
| Phone call inbound | 40 | 1.0 / 0.8 / 0.5 |
| "Request a quote" form fill | 45 | 1.0 / 0.8 / 0.5 |
| Service page visit (repair or install) | 20 | 1.0 / 0.6 / 0.3 |
| Google review click-through | 10 | 1.0 / 0.6 / 0.3 |
| Text message reply | 25 | 1.0 / 0.7 / 0.4 |
| Website form abandonment | 10 | 1.0 / 0.5 / 0.2 |
Notice the decay windows differ. A SaaS buying cycle often runs weeks or months, so a 30 day decay window makes sense. A local service call is typically an urgent, short-fuse decision, so a 14 day window (sometimes shorter, especially for emergency HVAC repair) reflects how fast that intent cools off. If a homeowner requested a quote for a broken furnace two weeks ago and hasn't responded since, they've likely already hired someone else. Your scoring model should reflect that reality instead of treating every industry on the same clock.
Scale the point values up or down based on your close rate and rep capacity. If your SaaS sales cycle is unusually long and your team can handle more sales-ready leads than the model currently produces, lower the sales-ready threshold rather than inflating every point value, which just shifts the whole scale without changing anything relative.
How Do You Measure and Refine Your Scoring Model?
A scoring model is never finished. Track four KPIs from day one: engagement-to-meeting rate (what percentage of "sales-ready" scores actually convert to a booked meeting), MQL to SQL conversion uplift compared to your pre-scoring baseline, time to first contact after a threshold trigger, and win rate segmented by score band. If your 100+ band doesn't close at a meaningfully higher rate than your 50 to 99 band, your weights are miscalibrated, full stop.
Run this as an actual test, not a gut check. Hold out a control group, roughly 10 to 20% of new leads, and route them using your old process while the rest flow through the new scoring model. Give it at least a full sales cycle, sometimes two, before drawing conclusions, since a two week sample almost never has enough closed deals to say anything statistically meaningful. Smaller sales teams especially need to resist the urge to declare victory after the first good week.
Set a review cadence and hold to it:
- Weekly during rollout: check score distributions for anomalies, confirm tracking is firing correctly, and spot check a handful of individual scores against what the rep actually saw.
- Monthly: recalibrate thresholds against updated conversion data, adjust for any new product launches or campaign types that introduce new behaviors to score.
- Quarterly: retrain the whole model, revisit weights against a full quarter of closed-won and closed-lost data, and retire any signal that's stopped correlating with outcomes.
When you see false positives (high scores that never convert), look first at whether one noisy signal is inflating the number, often a low-value action that's firing too frequently. When you see false negatives (deals that closed without ever crossing your threshold), check whether an important signal, maybe a phone call or an offline touchpoint, isn't being captured at all. Both problems point back to the same fix: adjust weights or add missing signal categories, then re-test before rolling the change out broadly.
What Goes Wrong With Engagement Scoring, and How Do You Prevent It?
Most broken scoring models fail in predictable ways. Overfitting to past wins is the most common: a model built entirely on last year's closed deals will over-weight whatever behaviors happened to correlate with that specific cohort, even if the correlation was coincidental. Optimizing for vanity metrics is next, chasing email open rates or social follows because they're easy to measure, not because they predict revenue. Stale signals creep in quietly, an action that mattered two years ago (say, downloading a PDF whitepaper) can lose relevance as buyer behavior shifts toward video and interactive content. Broken tracking is the silent killer: a tag that stops firing after a website redesign can zero out an entire signal category for months before anyone notices. And noisy identity resolution, the same gap between account-level and person-level matching covered earlier, means some of your highest-scoring "engagement" might belong to sessions you can't actually attach to a real contact.
Governance is what keeps these failure modes in check:
- Document every weight and every change to it, with a date and the reason for the change.
- Assign a single owner accountable for the model, even if multiple people contribute to it.
- Keep an audit log so you can trace a bad routing decision back to the exact weight change that caused it.
- Build in fairness checks: confirm the model isn't systematically underscoring segments that engage differently but convert just as well, like prospects who prefer phone calls over web forms.
On privacy, minimize how much personally identifiable information actually feeds the scoring calculation itself. You don't need someone's home address to score their engagement; you need behavioral events tied to an identifier. Honor opt-out and unsubscribe requests immediately, not on the next batch sync, and make sure your data deletion workflow actually removes scored records when a prospect requests it under applicable privacy regulations.
Practical mitigation is simpler than it sounds: build a signal health dashboard that flags when any single signal's volume drops or spikes more than 30% week over week, run outlier detection on individual scores (a lead jumping from 10 to 200 overnight deserves a look before it hits a rep's queue), and schedule a manual spot check of ten random scored leads every month against what actually happened in the CRM.
How Signal Engine Applies Engagement Scoring in Practice
Signal Engine was built around the exact problem this article describes: small and midsize teams don't have a data science department to build and maintain a scoring model by hand. The platform watches customer and prospect behavior automatically, scores that behavior using weighted, decay-adjusted point systems, and routes the output into playbooks without a rep having to build a single spreadsheet formula.
The mechanics follow the same architecture covered throughout this guide: behaviors get classified into a taxonomy, weights get assigned based on how strongly each action has historically correlated with a closed deal, and recency decay keeps stale activity from inflating a score that no longer reflects live intent. Once a prospect crosses a threshold, the system can trigger routing to a rep, kick off an automated email or SMS sequence, or flag the account for a manual review, depending on how the business has configured its playbooks.
Teams that track engagement metrics systematically, rather than glancing at them occasionally, report meaningfully better outcomes: roughly 28% higher quota attainment and 19% faster sales cycles compared to teams that don't.
For a reader wanting to replicate this setup without buying a platform, the mapping is straightforward: start with whatever CRM you already use as the system of record, connect your website analytics and email platform so behavioral events actually land somewhere, then layer a scoring logic on top, whether that's a built tool or a well-documented spreadsheet model, and connect the output to a routing rule your sales team already understands.
When Should You Trust the Algorithm, and When Should a Human Step In?
Automation should own the repetitive, high-volume decisions: routing a lead that crosses a clear threshold, triggering a nurture sequence, flagging a score spike for review. Automation should never own the ambiguous, high-stakes calls.

A few practical lines worth drawing. Automation handles routing and initial alerts for standard deal sizes and straightforward accounts, full stop, because speed matters more than judgment at that stage. Human review takes over for complex, multi-stakeholder deals where the buying committee's behavior doesn't fit a simple point model, for VIP or strategic accounts where a wrong move costs more than a missed SQL, and for any situation where a signal looks contradictory, like a prospect requesting a demo and unsubscribing from your newsletter in the same week.
One concrete rule of thumb worth adopting: if an account's potential annual contract value exceeds a threshold that matters to your business, say $25,000 ARR for a mid-market SaaS company, require a human to review the account's full engagement history before a demo gets auto-scheduled, rather than letting a scoring trigger book it blind. The cost of a rep spending five extra minutes reviewing context is nothing compared to walking into a demo for a strategic account without knowing that the "engagement spike" was actually a disgruntled existing customer researching how to cancel.
The algorithm is a filter, not a judge. It tells you where to look first. It doesn't replace the conversation a good rep has once they get there.
Ready to Run Engagement Scoring Without Building It From Scratch
Everything in this guide, the weighted point models, the recency decay, the threshold routing, is exactly what Signal Engine automates out of the box. You don't need a data team or a homemade spreadsheet to get a working scoring system live.

The platform watches prospect and customer behavior continuously, applies weighted scoring with built-in decay so stale activity stops inflating priority, and routes sales-ready accounts straight into automated email and SMS playbooks or a rep's queue. It comes with prebuilt integrations for common CRMs and communication tools, so the identity resolution and data plumbing problems covered earlier in this guide are handled before you ever log in. Dashboards show score distributions and routing outcomes in one place, which means the weekly monitoring and monthly calibration this article recommends takes minutes instead of a spreadsheet audit.
Setup runs in about five minutes, built for teams that don't have a RevOps department standing by. If you want to see how it maps to your own pipeline before committing, the live demo walks through scoring and routing on your actual use case.
Ready to Stop the Revenue Leak?
Signal Engine gives small and local businesses 31 AI-powered tools to score leads by buying intent, predict churn before it happens, auto-generate email and SMS campaigns, and recover missed calls automatically — all in one dashboard starting at $49/month.
Start your free 7-day trial — no credit card required. Setup takes 5 minutes.
Sources
- Leadsources
- How to calculate engagement rate (6 formulas) - Hootsuite Blog
- Engagement Metrics: Leading Signals of Intent and How to Read Them | Outsales
- B2B Prospect Engagement Strategy: The 2026 Playbook | Knock2 Blog
- Essential Sales Engagement Metrics and KPIs for 2026 | BizAI
FAQ
What is engagement scoring?
Engagement scoring is a method of assigning numeric point values to a prospect's behaviors, like website visits, email clicks, or demo requests, to measure buying intent and prioritize outreach.
What is Pardot scoring and how does it work?
Pardot, a marketing automation platform, uses a scoring model that assigns points for prospect activities like email opens and page visits, similar to the weighted, decay-adjusted models described throughout this guide, though the exact point values are configured per account.
Can you give me an example of lead scoring?
A simple example: a demo request earns 50 points, a pricing page visit earns 25, and a blog read earns 5, with older actions losing value over time through recency decay until the total crosses a threshold that triggers sales outreach.
What is a good engagement survey score?
Survey engagement benchmarks vary widely by context, but for social and content engagement generally, a 1% to 5% engagement rate is a reasonable baseline depending on platform and industry.
How is prospect engagement scoring different from lead scoring?
Prospect engagement scoring measures what someone does right now, like recent site visits or demo requests, while traditional lead scoring blends that behavior with firmographic fit data like company size and job title.