

Fix data hygiene and domain authentication first, segment your funnel by source and device, measure Revenue Per Visitor (RPV) as your primary business KPI, then automate recovery using behavioral scoring. That sequence is the entire playbook. Everything below shows you exactly how to execute it.
The core metrics to track right now:
- Revenue Per Visitor (RPV): total revenue ÷ total sessions. This ties your conversion work directly to dollars.
- Reply rate and positive-reply rate: the real signal in outbound sequences, not opens.
- Signal-tier resolution: account-level vs. person-level identification, which determines outreach intensity.
- Deliverability metrics: bounce rate, inbox placement, and sender reputation.
B2B contact data progressively loses accuracy over time, so your list degrades continually. Verify before you scale. Apple Mail Privacy Protection has reduced the reliability of open rates as a primary signal since iOS 15, so it's advisable to exclude them from your primary KPIs. Signalengine's behavioral scoring handles signal-tier resolution automatically for SMBs across 12 verticals.
Table of Contents
- Which engagement and conversion metrics actually drive revenue?
- Is your tracking foundation solid enough to trust?
- How do you find exactly where prospects stall in your funnel?
- How do you prioritize which leaks to fix first?
- How do you design experiments that measure real lift?
- How does behavioral scoring recover prospects before they disappear?
- How do you implement this playbook with Signalengine?
- What does a realistic 30/60/90 day plan look like?
- Key Takeaways
- The mistake most operators make before they even look at the data
- Ready to Stop the Revenue Leak?
- FAQ
Which engagement and conversion metrics actually drive revenue?
Conversion rate alone tells you almost nothing. Blended averages hide underperforming traffic sources and device segments where your real leakage lives.
Metric formulas and benchmark ranges:
| Metric | Formula | Benchmark Range |
|---|---|---|
| Conversion Rate | Conversions ÷ Unique Visitors × 100 | 2%–5% (landing pages, varies by vertical) |
| Revenue Per Visitor (RPV) | Total Revenue ÷ Total Sessions | Varies; track directional lift, not absolute |
| Reply Rate (outbound) | Replies ÷ Emails Delivered × 100 | 3%–8% cold; warm sequences vary widely |
| Positive-Reply Rate | Positive Replies ÷ Total Replies × 100 | 30%–50% of replies should be positive |
| Speed-to-First-Touch | Time from signal to first outreach | Ideally very fast for inbound leads |
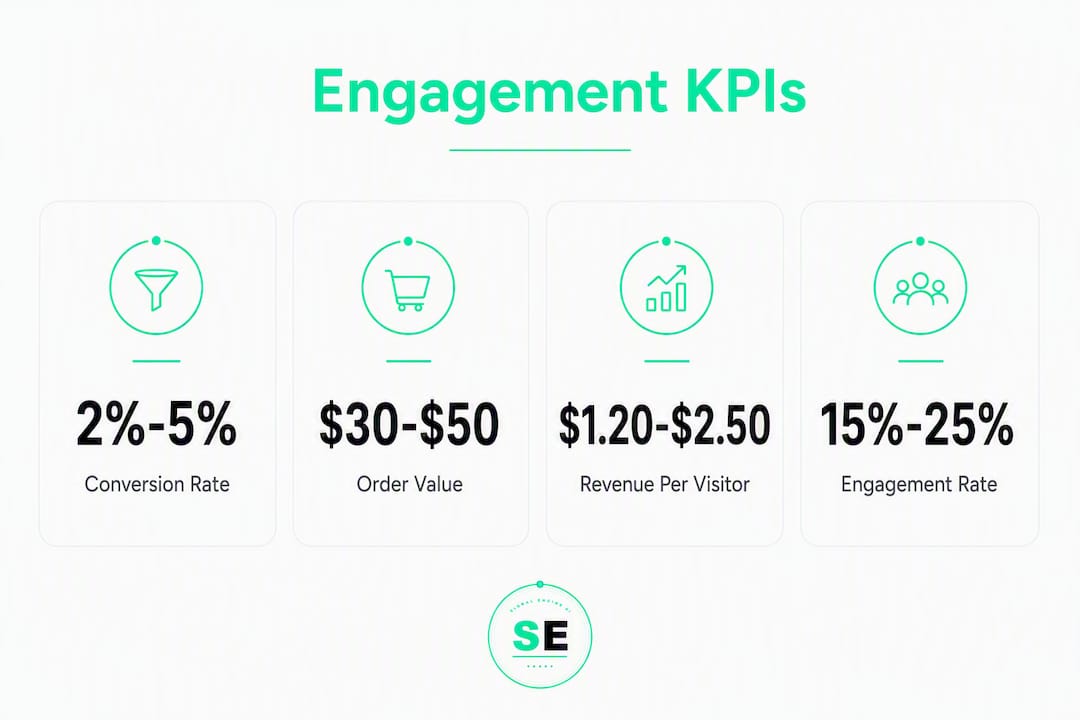
RPV combines conversion rate and order value into a single business-value metric, which is why it belongs at the top of your reporting stack. A 0.5% conversion rate lift means nothing if average order value dropped.
Macro vs. micro conversions: Macro conversions are the outcomes that generate revenue directly — a demo booked, a paid subscription started, a contract signed. Micro-conversions are the behavioral signals that predict them: a pricing page visit, a CTA click, a docs read. Track both, but optimize toward macro outcomes and use micro-conversions only when you can validate their correlation to revenue.
Denominator discipline matters. Use unique visitors for landing pages (one person, one decision). Use sessions for funnel steps where repeat visits indicate research behavior. Use impressions only for ad-level click-through analysis.
Is your tracking foundation solid enough to trust?
Bad data produces confident wrong answers. Before you run a single experiment, verify these items.
Data hygiene checklist:
- Remove or suppress contacts with hard bounces, invalid domains, and role-based addresses (info@, support@).
- Enrich stale records. With B2B contact lists degrading by roughly 28% per year, any list older than six months needs a verification pass.
- Authenticate your sending domain: SPF, DKIM, and DMARC records must all pass. Unauthenticated domains get filtered before your message reaches a human.
- Standardize UTM parameters across every channel. One team using
utm_source=emailand another usingutm_source=Emailcreates two separate buckets in GA4. - Map CRM events to GA4 goals so form submissions, demo bookings, and purchases all fire as named conversion events.
Implementation steps:
- Tag every primary conversion event in GA4 with a descriptive name (
demo_booked,trial_started). - Validate with GA4 DebugView and a test session before going live.
- Confirm mobile page load speed is under 2.5 seconds. Short forms (3 fields or fewer) and fast load times are prerequisites before split-testing anything.
- Set up session recordings (Hotjar or Microsoft Clarity) to catch UI bugs that analytics miss.
Pro Tip: Fix domain authentication and data quality before increasing touch volume. A broken sending foundation burns your sender reputation faster than any cadence increase drives replies. Deliverability is the floor, not a feature.
How do you find exactly where prospects stall in your funnel?
Buyers self-educate across roughly ten touchpoints before a CRM record exists. That means your funnel leaks start earlier than most teams realize.
Choose meaningful segments first:
- Traffic source: organic, paid, direct, referral, email.
- Device: desktop vs. mobile (mobile conversion rates often run significantly lower on the same page).
- New vs. returning visitors.
- Deal size or vertical (HVAC vs. dental vs. logistics behave differently at every funnel step).
- Intent signals: which content they consumed before hitting a conversion page.
Funnel-mapping steps:
- Define one primary conversion goal per funnel (demo booked, trial started).
- List every micro-step between entry and that goal: landing page → pricing page → CTA click → form → confirmation.
- Instrument a GA4 event at each step.
- Pull a funnel visualization report and calculate the absolute drop at each step: visitor volume × drop rate.
- Pair quantitative drop-offs with session recordings and heatmaps to see why people leave, not just where.
Diagnostic questions at each step: Is the traffic aligned to the offer on this page? Is the CTA visible above the fold on mobile? Is a specific browser or region showing a technical error? These questions turn a drop-off number into a testable hypothesis.

How do you prioritize which leaks to fix first?
Read the funnel from the top down and find the largest absolute leak first. A 40% drop on a page that gets 5,000 visitors/month outranks a 60% drop on a page that gets 200.
Impact vs. effort matrix:
| Fix | Impact | Effort | Priority |
|---|---|---|---|
| UTM parameter cleanup | Medium | Low | Do this week |
| Form-field reduction (to 3 fields) | High | Low | Do this week |
| Mobile page speed fix | High | Medium | Sprint 1 |
| CTA copy and placement test | High | Low | Sprint 1 |
| Backend attribution changes | Medium | High | Quarter 2 |
| Full site redesign | High | Very High | Roadmap |
Playbook steps: diagnose the drop → form a hypothesis ("reducing form fields from 6 to 3 will lift demo submissions by X%") → size the expected RPV lift → map implementation effort → assign an owner and a deadline. Revenue leakage often hides in process gaps that look like traffic problems on the surface.
Avoid chasing open rates or raw click counts as primary KPIs. They are activity metrics, not revenue metrics.
How do you design experiments that measure real lift?
A reliable analysis loop runs six steps: define objectives, collect and clean data, segment, find patterns, interpret against benchmarks, then test and iterate. The test step is where most SMB teams skip ahead and invalidate their results.
Experiment design steps:
- One hypothesis per test. "Changing the CTA from 'Submit' to 'Book My Demo' will increase demo submissions."
- One primary KPI per test: a macro conversion or a validated micro-conversion.
- Calculate required sample size before launching. Use a sample-size calculator (Evan Miller's is free and accurate) targeting your minimum detectable effect.
- Run the test to statistical significance (95% confidence minimum) before calling a winner.
- Measure RPV lift, not just conversion-rate percent change. A test that lifts conversions but attracts lower-value buyers can hurt revenue.
Pro Tip: Run sequential experiments on distinct segments (organic vs. paid, desktop vs. mobile) rather than pooling all traffic. Heterogeneous traffic masks segment-level wins and inflates your required sample size. Track lift per winning test and compile cumulative revenue impact for stakeholder reporting.
CRO program KPIs should include test velocity, win rate, and average lift per win — not just the outcome of any single test.
How does behavioral scoring recover prospects before they disappear?
The engagement window closes before a CRM record exists for many high-intent buyers. Behavioral scoring captures that window.
Signal weighting template:
| Signal | Weight | Tier Trigger |
|---|---|---|
| Pricing page visit | +25 | Tier 2 if repeated |
| Docs or case study read | +15 | Tier 1 |
| 3+ pages in one session | +20 | Tier 1 |
| Return visit within 7 days | +30 | Tier 2 |
| Demo page visit (no submit) | +40 | Tier 2 immediately |
Automation flow by tier:
- Tier 1 (account-only signal): Light outreach — a personalized email referencing the content they viewed. No phone, no LinkedIn yet.
- Tier 2 (person-identified): Full personalized cadence across email, phone, and LinkedIn. Multichannel sequences produce up to 287% more engagement than single-channel.
- Tier 3 (multi-thread, high score): AE intervention, multi-stakeholder outreach, executive-level touch.
Route Tier 2 and Tier 3 alerts into your CRM or Slack so reps act within minutes, not days. Real-time alerts cut speed-to-first-touch dramatically. Use waterfall enrichment to push account-level signals toward person-level resolution before multithreading — person-level identification is achievable for a meaningful share of engaged sessions when enrichment is applied systematically.
How do you implement this playbook with Signalengine?
Signalengine handles the scoring, routing, and automation so your team focuses on conversations, not configuration.
Setup steps:
- Upload and verify your contact list inside Signalengine. Remove hard bounces and stale records.
- Connect your sending domain and confirm SPF, DKIM, and DMARC pass.
- Map your CRM events to Signalengine's pipeline so demo bookings and trial starts fire as scored outcomes.
- Configure behavioral scoring rules using the signal weights above. Signalengine's signal scoring automates lead prioritization without manual analysis.
- Enable Slack or CRM alerts for prospects crossing your Tier 2 threshold.
- Activate a Tier 1 automated email sequence for account-level signals.
Vertical examples:
- HVAC: Weight pricing page visits and seasonal service pages heavily. A prospect who visits your "AC tune-up pricing" page twice in a week is a Tier 2 signal. Route to the nearest tech or sales rep immediately.
- Dental: Weight appointment booking page visits and insurance verification pages. A visitor who reads your new-patient FAQ and hits the scheduling page without booking is a Tier 1 signal for a follow-up text sequence.
- Local services (landscaping, salons): Weight repeat visits and quote-request page abandonment. These prospects often need one more touch to convert.
Finish checklist: tracking validated in GA4, one A/B test live, Tier 1 automation enabled, quarterly review scheduled.
What does a realistic 30/60/90 day plan look like?
30 days — fix the foundation:
- Complete data hygiene: verify contacts, remove stale rows, authenticate sending domain.
- Instrument GA4 events for all primary conversion goals.
- Map one funnel end-to-end and identify the top two drop-off points.
- Launch one prioritized quick-win test (form-field reduction or CTA copy).
60 days — run and measure:
- Run initial experiments to 95% statistical significance.
- Implement winning variants and measure RPV change.
- Enable Tier 1 automated flows and CRM/Slack routing.
- Review deliverability metrics: bounce rate, inbox placement, reply rate by segment.
90 days — scale what works:
- Scale successful automations to Tier 2 and Tier 3 flows.
- Run 3–4 concurrent tests across distinct segments (source, device).
- Present cumulative revenue impact to stakeholders using test velocity, win rate, and RPV lift.
Note: deliverability fixes take 2–4 weeks to show measurable inbox placement improvement after domain authentication. Low-traffic funnels (under 1,000 visitors/month) need longer test windows to reach significance — plan for 60–90 days on those.
Key Takeaways
Fixing data hygiene and domain authentication before scaling outreach is the single highest-leverage move in any prospect engagement and conversion program.
| Point | Details |
|---|---|
| Fix the foundation first | Verify contacts, authenticate your domain (SPF, DKIM, DMARC), and map CRM events before scaling cadence. |
| Segment before you optimize | Split conversion data by source, device, and behavior — blended averages hide the leaks that cost you revenue. |
| Measure RPV, not just conversion rate | RPV (total revenue ÷ total sessions) ties your CRO work directly to business value and catches order-value drops a rate metric misses. |
| Prioritize by absolute leak size | Multiply visitor volume by drop rate at each funnel step; fix the largest absolute leak first, not the highest percentage drop. |
| Signalengine automates the scoring | Signalengine's behavioral scoring and tiered automation recover high-intent prospects without manual analysis, starting at $49/month. |
The mistake most operators make before they even look at the data
Most struggling outreach sequences are not copy problems. They are data problems or deliverability problems wearing a copy costume. I've seen teams rewrite subject lines six times while their sending domain sits unauthenticated, filtering half their sends before a human ever sees them.
The other blind spot is the blended metric. A single aggregate conversion rate feels like clarity. It is not. It is an average of very different behaviors — organic visitors who already trust you, paid visitors who are skeptical, mobile users hitting a broken form, desktop users converting at twice the rate. When you blend those, you optimize for a ghost.
The teams that consistently improve RPV do one thing differently: they operationalize a quarterly review rhythm. Not a one-time audit. A scheduled, recurring look at segment-level performance, test results, and automation outcomes. That rhythm is what separates revenue teams from activity teams.
Ready to Stop the Revenue Leak?
Signal Engine gives small and local businesses 31 AI-powered tools to score leads by buying intent, predict churn before it happens, auto-generate email and SMS campaigns, and recover missed calls automatically — all in one dashboard starting at $49/month.
Start your free 7-day trial — no credit card required. Setup takes 5 minutes.

If you want to see how Signalengine maps to your specific vertical before committing, the live demo walks through the scoring, routing, and automation setup in under 20 minutes. No sales pressure, no credit card.
FAQ
What is Revenue Per Visitor and why does it matter?
RPV equals total revenue divided by total sessions. It combines conversion rate and order value into one metric, so a test that lifts conversions but lowers average deal size still shows a net loss.
How do you analyze prospect engagement without reliable open-rate data?
Use reply rate, positive-reply rate, and behavioral signals (page depth, return visits, pricing page views) as your primary engagement indicators. Apple Mail Privacy Protection makes open rates unreliable as a standalone signal.
How long does it take to see results from data hygiene fixes?
Domain authentication improvements typically show measurable inbox placement gains within 2–4 weeks. Contact-list verification lifts reply rates within the first send cycle after cleanup.
What is signal-tier resolution in prospect engagement?
Signal-tier resolution is the process of classifying a prospect signal as account-level (company identified, no person) or person-level (specific individual identified). Signalengine automates this classification and routes outreach intensity accordingly.
How many touches does a B2B prospect typically need before converting?
Research shows most deals require multiple touches, yet many reps stop after one. A structured multichannel cadence of 8–12 touches over 17–21 days covers the effective engagement window for most B2B motions, with coordinated multichannel sequences producing up to 287% more engagement than single-channel outreach.