

TL;DR:
- Most businesses focus on total revenue, but analyzing revenue per customer reveals true growth drivers. Calculating ARPC with consistent definitions and accurate periods enables smarter pricing, retention, and sales strategies. Contextual pairing with CAC and segmentation uncovers hidden risks and opportunities for revenue optimization.
Most business owners track total revenue and call it a day. That leaves a much more telling number on the table: revenue per customer. Understanding what is revenue per customer, also known formally as Average Revenue Per Customer (ARPC), gives you a sharper read on your business health than top-line sales ever will. It reveals whether you're growing because you're adding customers, or because each customer is genuinely spending more. That distinction drives smarter pricing, better retention, and more focused sales strategy.
Table of Contents
- Key Takeaways
- What is revenue per customer and how to calculate it
- Common calculation mistakes and how to avoid them
- How context shapes what your numbers actually mean
- Practical ways to grow revenue per customer
- A walk-through: from raw numbers to real decisions
- My take on why most businesses get this wrong
- How Signalengine helps you act on this data
- FAQ
- Ready to Stop the Revenue Leak?
Key Takeaways
| Point | Details |
|---|---|
| ARPC is the core metric | Divide total revenue by your active customer count for the same period to get an accurate baseline. |
| Denominator definition matters | Decide upfront whether you're counting paying users, active accounts, or all registered customers, then stay consistent. |
| Net revenue beats gross | Using net revenue after refunds and discounts gives a more honest picture of what each customer actually contributes. |
| Averages can mislead | Segment by cohort or plan tier to uncover high-value customers and concentration risks hiding inside your average. |
| Context beats benchmarks | Pair ARPC with CAC and churn rate to judge whether the number is actually healthy for your business model. |
What is revenue per customer and how to calculate it
Revenue per customer, or ARPC (Average Revenue Per Customer), is the total revenue your business generates divided by the number of customers during the same measurement period. The formula is simple:
ARPC = Total Revenue ÷ Number of Customers (same period)
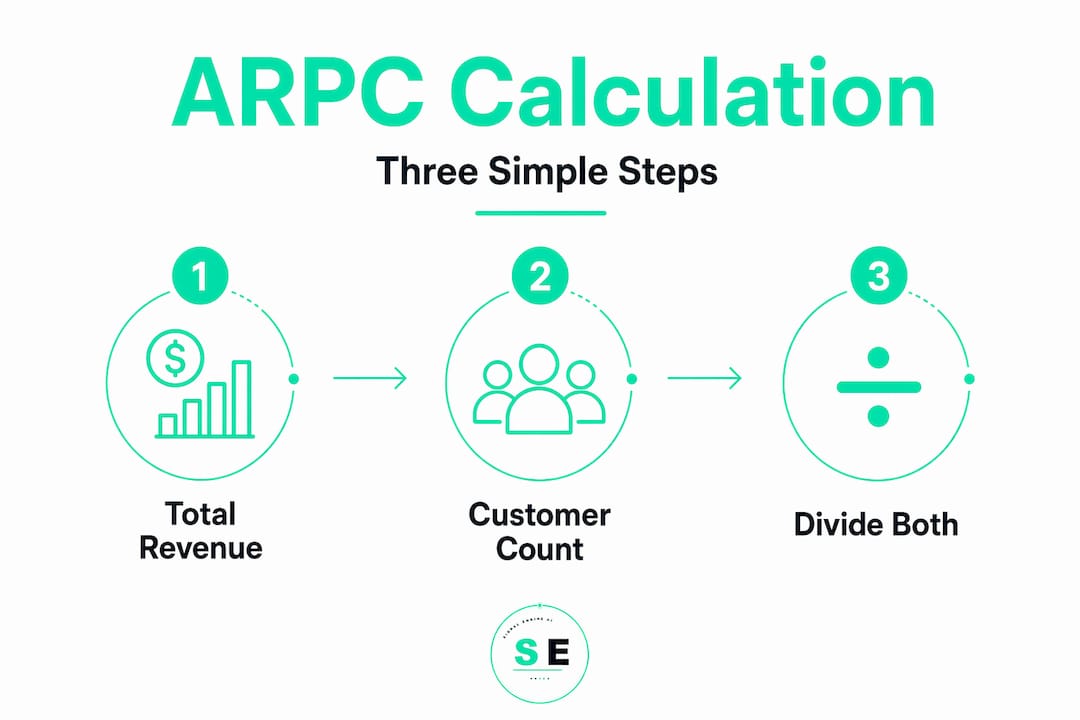
If your business brought in $20,000,000 over 12 months across 300 active customers, your ARPC is $66,666.67. Clean math, but the real work is in defining your terms before you divide.
You will run into several related acronyms depending on your industry. Here is how they break down:
- ARPC (Average Revenue Per Customer): Used broadly across B2B and service businesses where "customer" is the billing unit.
- ARPU (Average Revenue Per User): Common in SaaS and apps. One customer account may contain multiple users, so ARPU vs ARPC can tell different stories about the same business.
- ARPA (Average Revenue Per Account): Used in SaaS platforms where accounts are the billing entity, not individual users.
- ARPPU (Average Revenue Per Paying User): Strips out free-tier or inactive users to focus only on paying customers.
The denominator you choose changes everything. A free-to-paid SaaS product with 10,000 registered users but only 1,000 paying subscribers will show a very different ARPU depending on which count you use.
Pro Tip: Always state your denominator in your reporting. Write "ARPC (paying accounts, monthly)" instead of just "ARPC." That single habit prevents months of confusion when your team revisits the data.
Period matching is just as critical as denominator choice. Your revenue figure must cover the exact same timeframe as your customer count. Mix a full-year revenue figure with a single-month active user count, and your metric is meaningless.
Common calculation mistakes and how to avoid them
Getting the formula right is the beginning, not the finish line. Here are the four most common errors that skew your customer revenue analysis:
-
Mismatched time periods. Pulling annual revenue but counting customers as of today creates a distorted figure. Period alignment between your numerator and denominator is non-negotiable. Use monthly revenue with monthly active customers, or annual revenue with annual active accounts.
-
Using gross instead of net revenue. Gross revenue includes refunds, chargebacks, and discounts that never actually hit your bank account. Net revenue reflects what truly flows from customer relationships. For a business with a 15% return rate, the difference between gross and net ARPC can be dramatic.
-
Inconsistent customer definitions across reporting periods. If you count "any customer with an order in the past 12 months" in Q1 but switch to "monthly active users" in Q2, your trend data is worthless. As active customer definitions shift, metric outcomes shift with them, even if actual customer behavior stays the same.
-
Trusting the average without checking what's underneath it. One enterprise client paying $500,000 a year can inflate your ARPC enough to make a struggling mid-market segment look healthy. The average can mask concentration risks and declining cohorts. Check both ends of your distribution, not just the middle.
Pro Tip: Build a simple data dictionary for your revenue metrics. Even a shared Google Doc that defines each term saves hours of back-and-forth when sales, finance, and marketing look at the same dashboard and see different numbers.
You can also spot hidden revenue losses tied to these calculation errors faster than you think, once your definitions are locked in.
How context shapes what your numbers actually mean
There is no universal "good" ARPC. A B2B software platform with $2,000 monthly ARPC might be underperforming. A local gym with $80 monthly ARPC might be thriving. The number only tells you something meaningful when you set it next to the metrics that frame it.
The most important pairing is ARPC against CAC (Customer Acquisition Cost). If your average revenue per customer over a 12-month period is $1,200 and it costs you $1,800 to acquire each new customer, you have a unit economics problem regardless of how fast you're growing. As Stripe notes, ARPU without context from CAC and retention metrics gives you an incomplete picture at best.

Here is how ARPC benchmarks tend to vary by business type:
| Business type | Typical ARPC range | Key denominator |
|---|---|---|
| Consumer mobile app (freemium) | $1–$15/month | Monthly active users |
| SMB SaaS (subscription) | $50–$500/month | Paying accounts |
| Mid-market SaaS | $500–$5,000/month | Active accounts |
| B2B professional services | $2,000–$50,000/year | Billed clients |
| E-commerce (repeat buyers) | $100–$800/year | Annual purchasing customers |
Use this table as a directional reference, not a hard target. Your specific acquisition economics, pricing model, and market segment all shift what "healthy" looks like.
Segmentation is where the real insight lives. Breaking your customer base into cohorts by acquisition channel, plan tier, or contract start date often reveals that revenue concentration risks are hiding inside a healthy-looking average. A SaaS company might have an ARPA of $400/month overall, but find that 20% of accounts represent 70% of revenue. That is useful intelligence for retention planning and sales prioritization.
A few other metrics to pair with your ARPC analysis:
- Churn rate: Falling ARPC combined with rising churn signals product-market fit issues.
- Net Revenue Retention (NRR): If NRR exceeds 100%, your existing customers are spending more over time.
- Revenue per transaction: Useful for e-commerce businesses measuring order-level value alongside account-level annual spend.
Practical ways to grow revenue per customer
Moving the needle on average revenue per customer does not always require new customers. Often, the fastest gains come from your existing base. Here is what works in practice:
- Reprice based on segment data. Your customer revenue analysis will likely reveal segments that are underpaying relative to the value they receive. Tiered pricing models that align with usage or outcomes give high-value customers a natural path to spend more.
- Build upsell triggers into your product or service workflow. If a customer hits a usage threshold, that is a live signal to offer an upgrade. For service businesses, milestone moments like a project completion or a contract renewal are natural upsell windows.
- Reduce churn before it happens. Retention is the most underused lever for growing revenue per customer. Keeping a $500/month customer for 24 months instead of 12 doubles their lifetime contribution without a single new sale. Tracking revenue growth per customer over time connects directly to customer lifetime value and should anchor your retention investment decisions.
- Cross-sell based on purchase patterns. Look at what high-ARPC customers buy together. Then build campaigns that offer those combinations to mid-tier accounts. The Bullstrap team used a similar checkout optimization strategy and added $25K in revenue without increasing their customer count.
- Standardize metric tracking so you can actually see what's working. You cannot improve what you cannot measure consistently. Consistent labeling across teams enables reliable testing of pricing changes or retention campaigns.
Pro Tip: Run a 90-day upsell experiment on your top 20% of customers by spend. Offer them one meaningful upgrade or add-on. Track ARPC before and after. You will often find that your highest-value customers are also your easiest upsell targets because they already trust the product.
A walk-through: from raw numbers to real decisions
Let's put the theory into practice with a concrete example.
Imagine a SaaS company called ClearOps with the following data:
| Metric | Value |
|---|---|
| Annual recurring revenue | $1,800,000 |
| Total registered users | 2,400 |
| Paying accounts (annual) | 600 |
| Monthly active paying accounts | 480 |
| Annual net revenue (after refunds) | $1,620,000 |
If ClearOps uses total registered users as the denominator, their ARPU looks like $750/year. If they switch to paying accounts, ARPA jumps to $3,000/year. Using monthly active paying accounts gives $3,375. None of these numbers are wrong. They are just answering different questions.
The ClearOps team decides to use net revenue divided by paying accounts as their standard ARPC: $1,620,000 ÷ 600 = $2,700/year.
When they segment by plan tier, they find that enterprise accounts (60 total) generate $810,000 of that revenue, or $13,500 each per year. Small business accounts (540 total) average just $1,500 each. The average masks a massive concentration risk.
Their response: a targeted retention program for enterprise accounts (their top revenue driver) and a new mid-tier plan designed to nudge small business accounts toward higher usage and spending. Six months later, ARPC across the paying base moved from $2,700 to $3,100. No new customer acquisition required.
My take on why most businesses get this wrong
I've worked with a lot of business owners who track revenue carefully but have never once sat down to define what their "average revenue per customer" actually measures. They pull a number, report it upward, and move on. That is a real problem.
What I've seen consistently is that the metric definition is the last conversation anyone wants to have. It feels administrative. It feels like something the analyst handles. But when sales, finance, and marketing are each using a different denominator, you get three different ARPC figures for the same quarter. That does not just cause confusion. It causes bad decisions.
My personal rule: lock in your denominator before your fiscal year starts, write it down, and do not change it mid-year unless you are willing to restate your historical data. A single consistent figure, even if imperfect, is more useful than three precise but incompatible ones.
The other thing I tell sales professionals specifically: stop treating ARPC as a finance metric. It is one of the best tools you have for prioritizing your pipeline. When you know which customer profiles generate the highest revenue per account over time, you stop chasing volume and start chasing fit. That shift in focus tends to move numbers faster than any campaign.
Tracking revenue metrics alongside CAC is where the real clarity starts. Do not skip that pairing.
— Bernard
How Signalengine helps you act on this data
Understanding your ARPC is step one. Acting on it is where most businesses stall.

Signalengine is built for exactly that gap. For SaaS teams and small businesses, the platform's revenue intelligence tools detect revenue leakage across your customer base, score accounts by churn risk, and surface upsell signals before an opportunity slips away. You get AI-powered segmentation, automated outreach, and a 30-day recovery playbook, all without a lengthy setup or a steep learning curve. Businesses using Signalengine see an average of $38K in recovery potential in their first month. You can watch a live demo to see how it works on real data.
FAQ
What is the revenue per customer formula?
Revenue per customer equals total revenue divided by the number of customers in the same period. Use net revenue for the most accurate result, and define your customer denominator clearly before calculating.
What is a good average revenue per customer?
There is no single benchmark. A healthy figure depends on your business model, customer acquisition cost, and churn rate. Compare your ARPC to your CAC and retention data to judge whether the number is sustainable.
How is ARPC different from ARPU?
ARPC measures revenue per customer account, while ARPU measures revenue per individual user. In businesses where one account includes multiple users, these two metrics can be very different and should not be used interchangeably.
How often should I calculate revenue per customer?
Monthly tracking works for most businesses, especially SaaS companies. Pair it with quarterly segmentation analysis to catch shifts in cohort behavior before they become revenue problems.
Why does my revenue per customer keep changing without new customers?
Changes in your customer mix, pricing, churn, or product upgrades all move the average. Segment your data to find whether the shift is coming from a specific cohort, plan tier, or acquisition channel.
Ready to Stop the Revenue Leak?
Signal Engine gives small and local businesses 31 AI-powered tools to score leads by buying intent, predict churn before it happens, auto-generate email and SMS campaigns, and recover missed calls automatically — all in one dashboard starting at $49/month.
Start your free 7-day trial — no credit card required. Setup takes 5 minutes.