

TL;DR:
- Effective agency ROI reporting connects work to client revenue using a clear metric, accurate attribution, and live dashboards. It requires agreeing on thresholds upfront, reliable data integrations, and consistent, transparent reporting to retain clients and prove causality. Automating this process with tools like Signalengine streamlines data collection and enhances trust through real-time, understandable results.
Agency client ROI reporting ties your agency's work directly to client revenue using three components: an agreed ROI metric, deterministic lead-to-deal attribution, and live CRM-connected dashboards rather than static PDFs. Get all three right and you keep clients. Miss any one and you're defending your fee every renewal cycle.
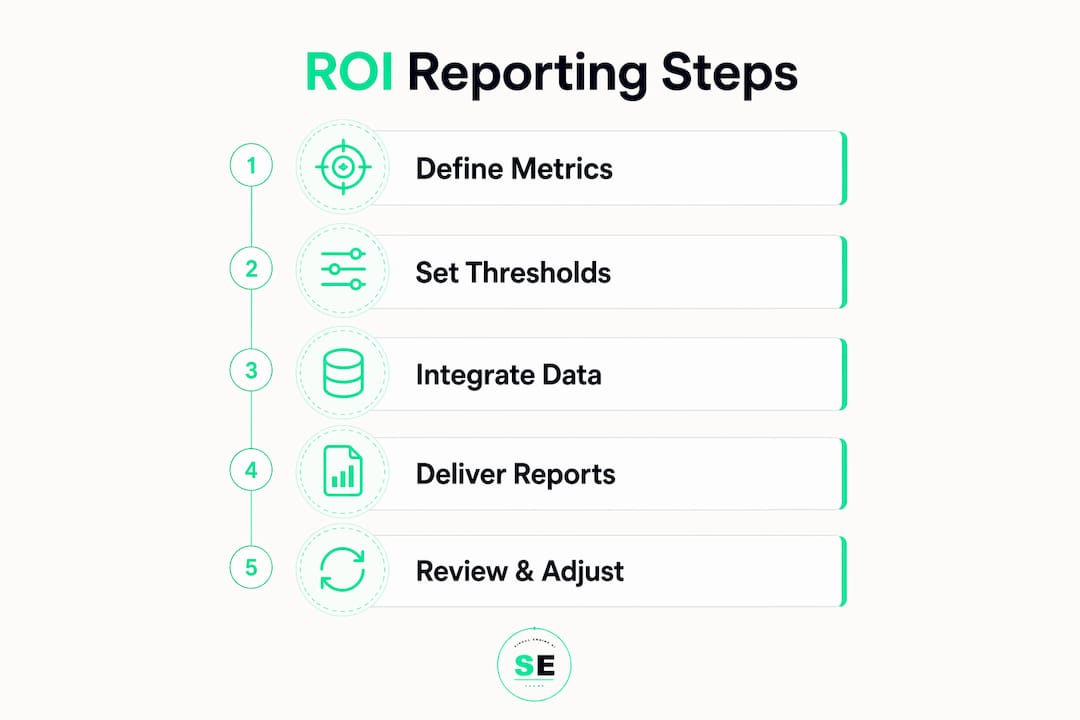
The four-step workflow every agency should follow:
- Step 1 — Pick your ROI metric: Choose First-purchase ROI, Lifetime Value (LTV) ROI, or Pipeline ROI based on the client's business model and sales cycle.
- Step 2 — Instrument tracking: Connect the CRM, implement server-side event collection, and map lead IDs to deal objects so every closed sale traces back to a source.
- Step 3 — Build live dashboards and alerts: Replace monthly PDFs with a portal clients can open anytime. Set threshold alerts so no one is surprised.
- Step 4 — Prove causality: Run holdout tests, geo-splits, or short pause experiments to show your work caused the revenue change, not just correlated with it.
A substantial Net ROI is widely cited as a benchmark for long-term agency partnerships. That number only holds up when your attribution is clean and your reporting is live.
Table of Contents
- What does agency ROI reporting actually measure?
- How do you agree on ROI thresholds before work starts?
- What data and integrations do you actually need?
- Which report format fits which audience?
- How do you prove your work actually caused the revenue lift?
- How do you present ROI so non-technical clients trust it?
- What mistakes make ROI reports useless or misleading?
- Step-by-step setup checklist for live ROI reporting
- How Signalengine supports agency client ROI reporting
- Key Takeaways
- The report is the product, not the proof
- Ready to Stop the Revenue Leak?
- Useful sources
- FAQ
What does agency ROI reporting actually measure?
Choosing the right ROI type before you start reporting is the single biggest friction point between agencies and clients. Each metric answers a different question.
- First-purchase ROI measures new-customer acquisition revenue against total spend. Use it when the client needs immediate cash flow or is in a high-volume, low-repeat business like home services or event ticketing.
- LTV ROI measures the long-term value of customers acquired, factoring in repeat purchases, subscriptions, and upsells. Use it for dental practices, SaaS, or any subscription model where month-one revenue understates the real return.
- Pipeline ROI measures inbound pipeline sourced or influenced by agency activity. Use it for B2B clients with long sales cycles where closed revenue lags campaign spend by 60–180 days.
Beyond metric type, always show both Gross ROAS and Net ROI. Gross ROAS measures ad spend efficiency. Net ROI subtracts both ad spend and agency fees from revenue before dividing: Net ROI = ((Revenue − Ad Spend − Fee) / (Ad Spend + Fee)) × 100. A client's CEO cares about the bottom line, not the ad platform's efficiency score.
How do you agree on ROI thresholds before work starts?
Misalignment on what "success" looks like kills more agency relationships than poor performance does. Document the following before the first campaign goes live:
- Primary KPI (one metric, not five)
- 2–3 supporting metrics that explain the primary KPI
- Baseline: current state before agency work begins
- Target and timeframe (e.g., 3:1 revenue multiple within 6 months)
- ROI threshold: the minimum acceptable return below which the engagement is reviewed
Threshold types to consider include a revenue multiple, a Net ROI percentage, or a payback period in months. Pick the one that matches how the client's CFO thinks.
Pro Tip: Get written sign-off on the threshold document before month one. When a bad month hits, you're debating performance against an agreed standard, not defending your existence.
QBR discipline materially improves renewal rates, and the month-9 QBR often functions as the actual renewal conversation. Set those four dates (months 3, 6, 9, 12) in the calendar on day one.
What data and integrations do you actually need?
Server-side tracking and CRM integration are now required for reliable closed-deal attribution. Cookie-based methods can't survive iOS privacy changes and browser restrictions. Here's the minimum technical stack:

| Integration | What it provides | Minimum acceptance criteria |
|---|---|---|
| CRM (deal objects + contact IDs) | Lead-to-deal mapping, closed revenue, pipeline stage | Every deal has a lead source field populated |
| Server-side event collection | Cookie-independent conversion signals | Events fire on server, not browser; verified in real time |
| Ad platform conversion imports | Offline conversion matching to ad clicks | GCLID / click ID passed to CRM and imported back |
| Payment / e-commerce feed | Actual revenue per transaction | Revenue matches CRM closed-won values within 2% |
| Call tracking export | Phone lead attribution | Call recordings tagged with UTM source and campaign |
Deterministic lead-to-deal mapping requires three things: a persistent lead ID from first touch through CRM entry, a canonical UTM strategy (no rogue campaign names), and a single customer ID that survives across sessions and devices. Without all three, your attribution is guesswork dressed up as data.
Data hygiene checklist:
- Standardize UTM naming before any campaign launches
- Enforce required CRM fields at deal creation (source, medium, campaign)
- Set a data latency rule: no report publishes if data is stale beyond a short, specified time frame.
- Run a test purchase monthly to verify the full tracking chain fires correctly
Which report format fits which audience?
Treat reporting as a system with four distinct report types, each with a different audience and cadence.
| Format | Cadence | Audience | Minimum content |
|---|---|---|---|
| Project status | Weekly | Project owner | Tasks completed, blockers, next actions |
| Campaign performance | Within 5 days of period end | Campaign owner | Spend, leads, pipeline sourced, ROAS |
| Monthly retainer report | 1st business week | Executive + operations | Net ROI, primary KPI vs target, trend |
| QBR | Months 3, 6, 9, 12 | Economic buyer | Cumulative ROI, retention analysis, renewal case |
Live dashboards beat static PDFs for one concrete reason: clients can check in at 10 PM on a Tuesday and see real numbers. That transparency reduces the "what am I paying for?" anxiety that drives churn. Connecting agency work to closed revenue through a live portal is now a retention tool, not a nice-to-have.
Delivery best practices: schedule reports on the same day each month, include a Loom walkthrough for any month where a primary KPI missed target, and automate data assembly so 70%–80% of the report builds itself. Reserve human time for the narrative.
How do you prove your work actually caused the revenue lift?
Correlation is not causation, and sophisticated clients know it. Three practical methods to show causality:
- Holdout groups: Withhold a segment of the audience from a campaign and compare conversion rates. Clean, but requires sufficient volume.
- Geo-holdouts: Run campaigns in some markets and pause in others. Works well for local service businesses.
- Short pause experiments: Pause a channel for 2–4 weeks and measure the revenue drop. Fast and convincing, though seasonality can contaminate results.
Realistic limits: holdout tests need adequate sample sizes to reach statistical significance, and cross-channel contamination (a user seeing both a paused and active channel) can muddy results. When a controlled test isn't feasible, use incremental contribution modeling: compare performance periods with similar seasonality and isolate the agency's channel contribution.
Agencies that run disciplined quarterly reviews see materially higher renewal rates. The month-9 QBR, framed around cumulative Net ROI and a forward retention strategy, is where most renewals are actually won or lost.
How do you present ROI so non-technical clients trust it?
Structure every client-facing report the same way:
- Executive summary (1 paragraph): What happened, why it happened, and the recommended next action.
- Trend lines: Primary KPI over the reporting period vs. the prior period and the agreed target.
- Contribution waterfall: Channel spend → leads generated → pipeline sourced → closed revenue.
- Net ROI vs. Gross ROAS chart: Side by side, so the CEO sees both the ad efficiency story and the bottom-line story.
- "Why this happened" section: Connect specific tactics to outcomes. If paid search drove 60% of pipeline, say so and explain what changed.
- Next action: One clear recommendation with an owner and a deadline.
Pro Tip: Always lead the QBR with Net ROI, not ROAS. ROAS is an ad platform metric. Net ROI is a business metric. CEOs respond to business metrics.
Proactive communication matters as much as the monthly report. Set alerts when a KPI crosses a threshold (up or down), send a one-paragraph inbox snapshot mid-month, and schedule QBRs at contract signing, not 30 days before renewal.
What mistakes make ROI reports useless or misleading?
- Vanity metrics as results: CTR and impressions without revenue context tell the client nothing about their business.
- Over-attribution: Claiming credit for revenue that would have happened anyway, usually caused by weak attribution rules or ignoring offline conversions.
- UTM and naming chaos: Inconsistent campaign names break deterministic matching and make pipeline source data unreliable.
- Stale or missing data: A report that doesn't include the client's primary KPI, or pulls data 5 days late, destroys credibility fast.
- Hiding the fee: Showing only Gross ROAS while omitting the management fee makes the agency look good and the client feel misled. Always show Net ROI.
- Ignoring fully loaded costs: Billing-rate-only analysis masks unprofitable clients. Salary, benefits, taxes, and overhead allocated by actual hours can flip a large retainer into a loss.
Roughly 20% of apparent ROI drops are actually tracking errors — a broken pixel, a misconfigured conversion event, or a payment feed that stopped syncing. Run a test purchase before you write the "bad month" narrative.
Step-by-step setup checklist for live ROI reporting
Onboarding (week 1):
- Get CRM admin access and verify deal objects have lead source fields.
- Document the primary KPI, 2–3 supporting metrics, baseline, target, and ROI threshold in writing. Get client sign-off.
- Implement the canonical UTM plan across all active campaigns.
- Set up server-side event collection and verify events fire correctly.
- Configure ad platform conversion imports (GCLID matching).
- Connect payment or e-commerce feed and reconcile against CRM closed-won values.
Automation setup (week 2):
- Build data connectors (CRM, ad platforms, payment feed) into your dashboard template.
- Configure alert rules: threshold breach, data staleness, and anomaly detection.
- Set up report delivery automation: portal link + Loom recording trigger for missed-KPI months.
Monthly cadence:
- Day 25: Schedule data pulls and verify all connectors are live.
- Day 28: Auto-pulls complete; review for data gaps or anomalies.
- Day 1 (next month): Write the executive narrative and "why this happened" section.
- Day 3–5: Deliver dashboard link + Loom walkthrough to client.
This production timeline keeps reporting time within budget and reserves human effort for the work clients actually read.
How Signalengine supports agency client ROI reporting
Signalengine is built for exactly this workflow. Its live pipeline dashboard connects directly to your CRM, pulling deal-stage data and closed revenue in real time so clients never wait for a PDF. Automated lead scoring flags which contacts are moving toward a close, giving account teams an early signal before the monthly report is due.
Key capabilities that map to the workflow above:
- CRM integrations: Native connectors pull deal objects, contact IDs, and revenue data for deterministic lead-to-deal mapping.
- Churn prediction: Signalengine's AI-powered churn detection flags at-risk accounts before they cancel, protecting the LTV ROI calculation.
- Automated narratives: AI-generated report summaries reduce the time spent writing the "what happened" section, so account managers focus on the "what next."
- Alerting: Threshold alerts fire when a KPI crosses a target, up or down, so no one is surprised at month-end.
- Offline revenue import: Closed deals from phone calls and in-person sales flow into the dashboard, keeping Net ROI accurate.
For service businesses tracking campaign-to-deal attribution, or subscription clients calculating LTV ROI, Signalengine surfaces the numbers without requiring a data team. See how it fits your stack at the live demo.
Key Takeaways
Effective agency client ROI reporting requires a single agreed metric, deterministic CRM-linked attribution, and live dashboards delivered on a fixed cadence with both Gross ROAS and Net ROI visible.
| Point | Details |
|---|---|
| Pick one ROI metric first | Agree on First-purchase, LTV, or Pipeline ROI in writing before any campaign launches. |
| Instrument deterministic tracking | CRM integration, server-side collection, and canonical UTMs are the minimum for reliable attribution. |
| Live dashboards retain clients | Real-time portal access builds trust and reduces churn more than any monthly PDF. |
| Always show Net ROI | Net ROI = ((Revenue − Ad Spend − Fee) / (Ad Spend + Fee)) × 100; CEOs need the bottom-line number. |
| Signalengine automates the stack | Signalengine connects CRM data, scores leads, predicts churn, and delivers live dashboards starting at $49/month. |
The report is the product, not the proof
Most agencies treat reporting as evidence they submit at the end of the month. The agencies that keep clients treat it as a product they ship on a schedule, with a defined format, a live portal, and a narrative that tells the client what to do next.
The hardest part isn't the data. It's the discipline of separating what the numbers say from what they mean. A waterfall chart showing channel contribution to closed revenue is a fact. The sentence that explains why paid search outperformed organic this quarter, and what you're doing about it, is the reason a client renews.
One pattern that shows up repeatedly in high-retention agencies: the month-9 QBR framed around cumulative Net ROI and a forward retention strategy. By that point, the client has seen three quarters of live data, the attribution is clean, and the conversation shifts from "prove your value" to "what do we do next year." That's the renewal conversation. And it only happens when the reporting system has been running cleanly since month one.
Automate the data. Handcraft the narrative. Deliver on time, every time.
Ready to Stop the Revenue Leak?
If your agency is still delivering static PDFs or manually assembling monthly reports, you're spending hours on work that should take minutes and leaving clients with stale numbers they can't act on.

Signalengine gives your revenue team AI-powered revenue intelligence that connects your CRM, scores leads by buying intent, predicts churn before it costs you a renewal, and surfaces live Net ROI dashboards automatically. It maps directly to the four-step ROI reporting workflow in this article: metric selection, deterministic attribution, live dashboards, and retention alerting. Book a live demo and see your pipeline data in the dashboard before you commit.
Signal Engine gives small and local businesses 31 AI-powered tools to score leads by buying intent, predict churn before it happens, auto-generate email and SMS campaigns, and recover missed calls automatically — all in one dashboard starting at $49/month.
Start your free 7-day trial — no credit card required. Setup takes 5 minutes.
Useful sources
- Agency Client Reporting: How to Prove Your Value Every Month — AgencyPro: Covers the four report types, QBR cadence, production timeline, and automation-to-narrative ratio.
- Agency Analytics: Proving Client ROI With Data — clariBI: Makes the case for live CRM-connected dashboards as a retention tool.
- How Marketing Agencies Prove ROI to Clients — LeadJourney: Covers server-side tracking and CRM integration for closed-deal attribution.
- 7 Ways to Show Marketing ROI to Your Clients — ClicData: Explains metric selection (First-purchase, LTV, Pipeline) and threshold documentation.
- Agency Campaign ROI Calculator — PanCalcHub: Net ROI formula and tracking error diagnostics.
- Agency Profitability Analysis: Calculate True Client ROI — Jumpstart Partners: Fully loaded cost accounting for true client margin analysis.
- Attribution for Agencies: How to Prove ROI to Clients — Corvidae: Cross-channel attribution challenges and futureproofing for a cookieless environment.
- How to Build a Revenue Dashboard Without a Data Team — Signalengine: Practical guide to building live CRM-connected dashboards without engineering resources.
- Why Agencies Need Revenue Attribution to Grow — Signalengine: Advanced techniques for connecting agency activity to closed revenue.
- TradePilot — First-Purchase ROI, LTV ROI, and Pipeline ROI Implementation: Partner resource for defining and tracking each ROI metric type in practice.
FAQ
What is the difference between Gross ROAS and Net ROI?
Gross ROAS measures revenue generated per dollar of ad spend. Net ROI subtracts both ad spend and the agency management fee from revenue, giving the client's CEO a true bottom-line return figure.
How do you attribute leads to closed revenue without third-party cookies?
Pass a persistent lead ID (such as a GCLID or first-party click ID) into the CRM at lead creation, then import closed-deal data back to the ad platform using server-side conversion imports. This deterministic matching survives browser privacy restrictions.
How often should agencies deliver ROI reports to clients?
Use four report types on separate cadences: project status weekly, campaign performance within 5 days of period end, monthly retainer reports in the first business week, and QBRs at months 3, 6, 9, and 12.
Can Signalengine replace manual ROI reporting for agencies?
Signalengine automates CRM data pulls, lead scoring, churn alerts, and live dashboard delivery, reducing manual assembly time significantly. Account managers still write the executive narrative, but the data layer builds itself.
What is an ROI threshold and why does it matter?
An ROI threshold is the minimum acceptable return agreed in writing before work begins, such as a 3:1 revenue multiple or 200% Net ROI. It gives both the agency and client a shared standard for evaluating performance and prevents misalignment at renewal time.