
TL;DR:
- Automated client reporting pulls live data into branded templates and delivers reports without manual effort. It replaces manual tasks with a system that connects data sources, generates narratives, and sends reports on schedule. This automation saves time, reduces errors, and enhances client relationships by providing consistent, clear, and timely insights.
Automated client reporting is the process of pulling live data from connected sources into governed, branded report templates and delivering finished reports to clients on a recurring schedule without manual rebuilding. Tools like Google Analytics 4, Google Ads, and Meta Ads feed data directly into the pipeline. AI models like Claude generate plain English narratives. Delivery platforms like SendGrid push the final report to each client's inbox. The result is a fully hands-off reporting cycle that scales without adding headcount.
How automated client reporting works: the core process
Client reporting automation runs through five distinct stages. Each stage removes a specific manual task from your team's plate.
-
Data aggregation. The system connects to your data sources via APIs. Google Analytics 4, Google Ads, and Meta Ads are the most common integration points. Single-click OAuth authorization handles most connections securely, so your team does not need to manage credentials manually.
-
Data normalization. Raw API data arrives in different formats. A workflow automation platform like n8n pulls the data, standardizes field names, and routes clean numbers into the report template. This step prevents mismatched metrics from breaking the final output.
-
AI narrative generation. Raw numbers alone do not tell a story. AI narrative tools like Claude convert metrics into 300–500 word plain English summaries that explain what changed and why. Clients read the narrative instead of decoding charts.
-
Report assembly. A PDF generator like Puppeteer or wkhtmltopdf compiles the branded layout, charts, and narrative into a finished deliverable. Automated systems produce complete branded reports in under 60 seconds once connected to key platforms.
-
Scheduled delivery. The finished PDF goes out via Gmail API, SMTP, or SendGrid on a fixed schedule, weekly, biweekly, or monthly, without anyone pressing send.
Pro Tip: Build your delivery schedule around your client's decision cycle, not your team's availability. A Monday morning delivery lands before the week's budget decisions, not after.
The full pipeline runs without human intervention after the initial setup. Full pipeline automation from data pull through delivery yields the highest efficiency and reduces error surface significantly.

How does automated reporting compare to manual reporting and dashboards?
Manual reporting and automated reporting solve the same problem in very different ways. The gap in time and accuracy is significant.
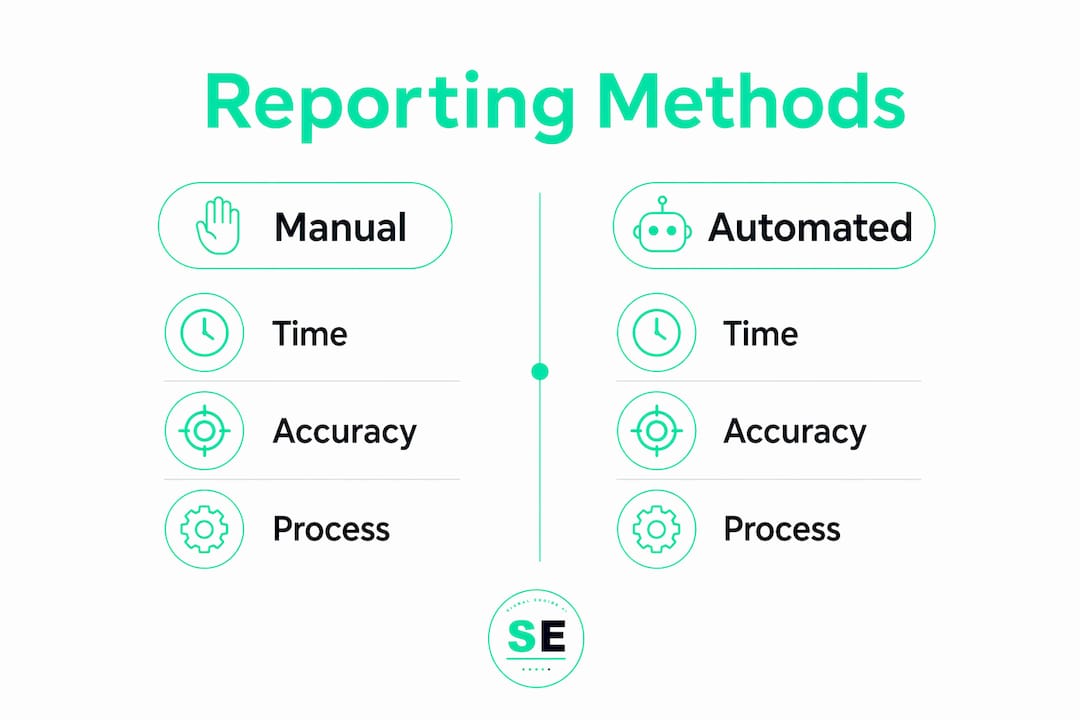
| Factor | Manual reporting | Automated reporting |
|---|---|---|
| Time per client per cycle | 3–8 hours | Under 30 minutes |
| Consistency | Varies by person | Governed by template |
| Error rate | High (copy/paste risk) | Low (API-sourced data) |
| Scalability | Limited by headcount | Scales without new hires |
| Client delivery format | Often inconsistent | Branded PDF every time |
Automating client reporting can reduce manual reporting time by up to 80%. For an agency with 3 managers and 75 clients, that translates to 600 hours saved monthly, equal to 1.5 full-time employees. That is not a marginal gain. That is a structural change in how your business operates.
Dashboards are a common alternative, but they fall short for client communication. Clients prefer definitive, static PDFs that deliver a polished narrative without requiring a login. A live dashboard puts the burden of interpretation on the client. A static report with a clear narrative does the thinking for them. That distinction matters when you are managing relationships, not just data access.
Client reporting also serves a different purpose than internal analytics. Client reports prioritize narrative clarity and decision support, not granular drill-downs. Sending a client a raw dashboard link is the equivalent of handing them a spreadsheet and calling it a presentation.
What are the practical considerations for implementing automated reporting?
Setting up client reporting automation correctly the first time saves significant rework later. These are the areas where most implementations go wrong.
Template governance is non-negotiable. Most time in client reporting is spent on formatting and manual layout corrections, not data extraction. Governed templates lock the layout so it cannot drift between reporting cycles. Without template governance, your reports look different every month and your brand credibility erodes.
API monitoring prevents silent failures. Connections break. A Google Ads token expires. A Meta API permission changes. Automated alerting on broken connections prevents sending empty or zero-filled reports to clients. Set up internal notifications the moment a data source disconnects.
Threshold-based internal alerts protect client relationships. Flagging significant metric drops internally before reports go out gives your account managers time to prepare. A greater than 15% week-over-week drop in a key metric should trigger an internal alert, not a surprise in the client's inbox.
Here is a practical checklist for your rollout:
- Audit all existing report formats and identify the common layout elements
- Set up data source connections and test each API with a live data pull
- Design a governed master template with locked branding and dynamic data fields
- Configure AI narrative prompts specific to each client's KPIs
- Set up API disconnect alerts before you go live
- Run a parallel test cycle, sending automated reports alongside manual ones, to catch discrepancies
- Roll out to two or three clients first, then scale after confirming accuracy
Pro Tip: Do not automate delivery until you have confirmed the data pull and narrative are accurate for at least two full reporting cycles. Sending a broken report at scale damages trust faster than sending it manually.
Typical implementation takes about 3 weeks across three phases: audit, workflow setup, and template design. A fully automated system then generates each client report in roughly 30 minutes per month, yielding a 3–5x return on investment in the first year.
Which tools and technologies power automated client reporting?
The technology stack for client reporting automation is modular. You can build it with widely available tools or use a platform that bundles the layers together.
- Data sources: Google Analytics 4, Google Ads, and Meta Ads APIs are the standard starting points. Most platforms support single-click OAuth for secure authorization.
- Workflow orchestration: n8n is a popular open-source platform that sequences the data pull, normalization, AI narrative call, report generation, and email delivery in one automated workflow.
- AI narrative generation: Claude and GPT models accept raw metric data and return plain English summaries. You control the tone, length, and focus through the prompt.
- PDF generation: Puppeteer (headless Chrome) and wkhtmltopdf both convert HTML templates into branded PDFs reliably at scale.
- Email delivery: SendGrid, Gmail API, and standard SMTP all handle automated report distribution. SendGrid adds delivery tracking and open rate visibility.
For businesses that want to understand how agency revenue reporting fits into this stack, the integration points above are the foundation. The best automated reports are invisible to clients. They arrive consistently, look polished, and require no action from the recipient to understand.
If you are evaluating whether to build this stack yourself or use a platform, consider the maintenance burden. Each API integration requires ongoing credential management, version updates, and error handling. A platform that manages those layers for you reduces the operational overhead significantly.
Key takeaways
Automated client reporting works by connecting live data sources to governed templates and delivering finished reports on schedule, removing manual effort from every step of the cycle.
| Point | Details |
|---|---|
| Full pipeline automation | Automate from data pull to delivery to maximize efficiency and minimize errors. |
| Template governance | Lock report layouts to prevent formatting drift and protect brand consistency. |
| API disconnect alerts | Monitor all data connections and alert your team immediately when one breaks. |
| AI narrative value | Use AI models like Claude to convert raw metrics into plain English client summaries. |
| Phased rollout | Test on two or three clients before scaling to catch errors before they reach everyone. |
Why automation changes the client relationship, not just the workload
Here is what I have seen consistently across businesses that make the shift to automated reporting: the biggest gain is not the hours saved. It is the change in how your team shows up to client conversations.
When your account managers are not spending Sunday nights rebuilding spreadsheets, they spend Monday mornings thinking about what the numbers mean. That shift from production to analysis is where client relationships actually improve. Clients notice when you call them before they call you. They notice when you flag a drop in performance before they see the report. Proactively flagging metric anomalies internally before delivery is what separates reactive agencies from trusted advisors.
The scalability argument is real, but it is secondary. Yes, you can handle more clients without burning out your team. But the more durable advantage is that your reporting becomes a product. It looks the same every month. It arrives on time. It tells a clear story. Clients stop questioning whether the numbers are right and start acting on them.
One thing I would push back on: the idea that automation removes the human element. The best automated reports I have seen are built on deeply human decisions about what to measure, what to highlight, and how to frame performance for a specific client. The automation executes those decisions at scale. It does not replace them. Build your templates with intention, and the automation amplifies your judgment rather than substituting for it.
— Bernard
Signalengine brings revenue intelligence to your reporting stack
Signalengine is built for business owners who need answers, not more data to sort through. It watches your customers, scores their behavior with AI, and flags who is about to leave before they do.
For businesses ready to move beyond manual reporting, Signalengine's AI-powered revenue tools connect lead scoring, churn prediction, and automated client insights in one dashboard. Plans start at $49/month with a 5-minute setup. You can also see it live before committing. No spreadsheets. No rebuilding reports from scratch. Just the signals your business needs to act on, delivered automatically.
Ready to Stop the Revenue Leak?
Signal Engine gives small and local businesses 31 AI-powered tools to score leads by buying intent, predict churn before it happens, auto-generate email and SMS campaigns, and recover missed calls automatically — all in one dashboard starting at $49/month.
Start your free 7-day trial — no credit card required. Setup takes 5 minutes.
FAQ
What is automated client reporting?
Automated client reporting is the process of connecting live data sources to branded report templates and delivering finished reports to clients on a recurring schedule without manual rebuilding. It replaces repetitive formatting and data pulling with a system that runs on its own.
How long does it take to set up automated client reporting?
Typical implementation takes about 3 weeks, covering an audit phase, workflow setup, and template design. A phased rollout starting with two or three clients reduces the risk of errors reaching your full client base.
Is automated reporting better than sending dashboard links?
Yes. Clients prefer static, branded PDFs over live dashboard links because they require no login and deliver a clear narrative. Dashboards shift the burden of interpretation onto the client, while a well-built automated report does that work for them.
What tools do I need to automate client reporting?
A standard stack includes a data source like Google Analytics 4 or Meta Ads, a workflow platform like n8n, an AI model like Claude for narrative generation, a PDF generator like Puppeteer, and an email delivery service like SendGrid. Each layer handles one stage of the pipeline.
How does automation prevent errors in client reports?
Automated alerting on API disconnects catches broken data connections before reports go out. Governed templates prevent layout drift. Together, these controls eliminate the copy-paste errors and formatting inconsistencies that make manual reporting unreliable at scale.