
TL;DR:
- Revenue gap analysis involves diagnosing discrepancies between actual revenue and full potential across sales, marketing, operations, and finance. Effective implementation requires stakeholder alignment, funnel forensics, financial auditing, and continuous monitoring to ensure durable results. Most gaps are caused by metric conflicts and organizational misalignments rather than sales underperformance, necessitating systemic diagnostics rather than quick fixes.
Revenue gap analysis is defined as the structured process of diagnosing the difference between a client's actual revenue and its full attainable potential across sales, marketing, operations, and finance. Knowing how consultants identify client revenue gaps separates advisors who deliver measurable results from those who produce reports that collect dust. The most effective diagnostic frameworks combine stakeholder mapping, funnel forensics, and financial auditing into a single repeatable system. Revenue gaps arise mainly from metric conflicts, timeline mismatches, data fragmentation, and organizational incentives rather than pure sales underperformance. That distinction changes everything about where you look first.
How consultants identify client revenue gaps: the core framework
The industry term for this discipline is revenue gap analysis, and it follows a four-step cycle: gap identification, impact quantification, intervention deployment, and ongoing monitoring. Most consultants skip directly to pipeline totals and miss the structural causes sitting underneath. A 4-step diagnostic cycle that includes biweekly tracking is what separates a one-time fix from a durable performance improvement. The framework works because it forces you to define what "revenue" means to each stakeholder before you measure anything.

Effective client revenue assessment starts with a clean baseline. You cannot quantify a gap without first agreeing on the numerator and denominator. Before touching a single spreadsheet, confirm that your client's CRM, ERP, and billing systems are pulling from the same source of truth. Skipping this step produces gap figures that every department disputes, which kills momentum before interventions begin.
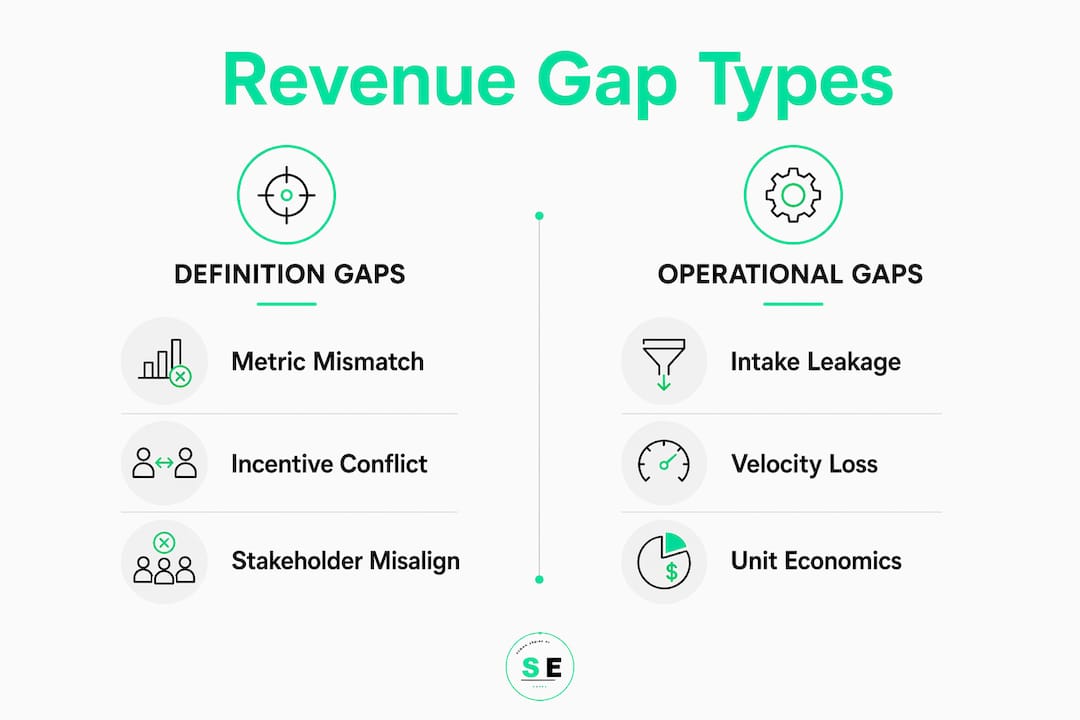
What are the main types of revenue gaps consultants look for?
Consultants who specialize in identifying revenue opportunities recognize four distinct gap categories. Each requires a different diagnostic lens and a different intervention playbook.
- Planning gaps measure the distance between total addressable market and the revenue the client actually planned to capture. A SaaS company targeting mid-market HR software may have a $40M addressable segment but a sales plan built for $12M. That $28M difference is a planning gap, and it often reflects conservative quota-setting or poor territory design rather than weak demand.
- Execution gaps compare the approved revenue plan against actual performance. Forecast accuracy gaps and quota attainment gaps often stem from territory design and quota allocation rather than individual rep performance. When fewer than 40% of reps hit quota, the structure is broken, not the people.
- Forecasting gaps expose the delta between predicted and actual revenue. These gaps reveal whether the client's CRM data and pipeline hygiene are reliable enough to support decisions. Inflated late-stage opportunities are a common culprit.
- Cash recognition and collection gaps track the difference between revenue recognized on paper and cash actually collected. Invoices aging past 90 days represent revenue that is not real operationally, and they distort every downstream metric the client uses to make decisions.
Classifying gaps before quantifying them prevents the common mistake of treating all shortfalls as sales problems. A collection gap needs a finance intervention. A planning gap needs a go-to-market redesign. Mixing them up wastes time and erodes client trust.
How do stakeholder mapping and KPI auditing reveal hidden misalignments?
Mapping all revenue-governing stakeholders and auditing their KPIs early prevents consulting engagement failure by aligning definitions and identifying metric conflicts upfront. The five stakeholder categories to document are executive sponsors, operational owners, data owners, frontline leaders, and blockers. Each group defines "revenue success" differently, and those differences produce gaps that look real in reports but do not exist in actual demand.
The KPI audit follows a numbered process that keeps the work organized and defensible:
- List every revenue metric in use across marketing, sales, finance, and customer success. Common examples include MQL, SQL, ARR, NRR, and pipeline coverage ratio.
- Document each team's definition of those metrics. Marketing's MQL definition and sales's SQL definition frequently diverge, creating a handoff gap where qualified leads disappear without a trace.
- Identify incentive conflicts. A sales team compensated on bookings will behave differently from one compensated on collected cash. That behavioral difference shows up as a revenue gap in the financials.
- Build a unified glossary that every stakeholder signs off on before the engagement proceeds. This single document eliminates the majority of metric disputes that derail gap analysis projects.
- Audit CRM field reliability. CRM data fields are often unreliable, causing hidden qualification leakage that inflates pipeline volume while masking true revenue potential.
Pro Tip: Ask each department head to define "a qualified lead" in writing before your first data pull. You will almost always get three different answers, and those differences are your first confirmed gap.
What funnel forensic techniques reveal lead-to-revenue leakage?
Lead-to-revenue leakage analysis treats the go-to-market funnel like a crime scene, investigating five leakage zones with specific formulas and forensic questions. This approach moves beyond volume metrics to compute actual revenue at risk.
| Leakage zone | What it measures | Key diagnostic question |
|---|---|---|
| Intake leakage | Leads generated but never worked | What percentage of inbound leads receive a response within 24 hours? |
| Qualification leakage | Leads advanced without meeting criteria | Does the pipeline quality ratio show late-stage deals outnumbering early-stage? |
| Velocity leakage | Deals stalling in a single stage | Which stage shows the longest average time-in-stage, and why? |
| Deal shape leakage | Discounting and scope reduction | What is the average discount rate by rep, and does it correlate with close rate? |
| Post-close leakage | Churn, downgrades, and failed expansions | What is the net revenue retention rate by cohort? |
The formula that quantifies intake leakage is direct: Revenue at Risk = Unworked Leads × Historical Lead-to-Revenue Conversion Rate. If a client generates 500 unworked leads per month and the historical conversion rate is 2% at an average deal value of $8,000, the monthly revenue at risk is $80,000. That number gets attention in a way that "we have a lead follow-up problem" never does.
Velocity leakage from deals stalling without formal exit criteria creates unseen forecast misses due to undocumented handoffs and approval inefficiencies. Time-in-stage spikes are the clearest signal. A deal sitting in "Proposal Sent" for 45 days in a business with a 30-day average sales cycle is not a pipeline asset. It is a forecast liability. You can find hidden revenue losses like this across multiple funnel stages simultaneously once you know what to measure.
Pro Tip: Pull a pipeline quality ratio by dividing late-stage opportunities by early-stage ones. A ratio above 2:1 almost always signals that reps are gaming stage progression to protect their pipeline from scrutiny.
How do financial audits of cash flow and AR support gap identification?
Cash flow and accounts receivable analysis form the financial foundation of any complete client revenue assessment. Without this layer, a consultant can identify operational gaps while missing the timing distortions that make those gaps worse.
AR aging beyond 90 days represents revenue that is not real operationally and distorts cash flow. Unpaid invoices older than 90 days function as interest-free loans to customers, not as revenue. Pairing AR aging analysis with a 13-week rolling cash flow forecast exposes timing mismatches between revenue recognition and actual cash collection. That combination reveals whether a client's reported revenue gap is a performance problem or a collection problem. The two require completely different fixes.
The financial audit checklist for gap identification includes:
- 13-week rolling cash flow forecast to surface timing mismatches between booked and collected revenue
- AR aging report segmented by customer to identify which accounts represent the largest collection risk
- Unit economics by customer segment including CAC, LTV, and LTV:CAC ratios to determine which segments drive real profit
- Gross margin by product line to identify whether revenue growth is masking margin compression
Forensic auditing of unit economics reveals which customer segments drive real profit and which subsidize loss. A client celebrating 20% revenue growth may be acquiring customers at a CAC that exceeds 24-month LTV in their fastest-growing segment. That is not a growth story. It is a gap that compounds over time. The metrics for detecting lost revenue across these financial dimensions are well-established, but most clients have never applied them systematically.
How can consultants implement continuous monitoring to close revenue gaps?
Identifying gaps is only half the work. The other half is building a monitoring system that catches new gaps before they become structural misses. Continuous or frequent revenue gap analysis at a monthly cadence for high-growth companies and quarterly for mature ones helps detect small variances early.
The implementation sequence follows four steps:
- Classify and quantify every identified gap by type and dollar impact. A qualification leakage gap worth $200K per quarter gets prioritized differently than a collection gap worth $15K. Dollar impact is the only objective ranking criterion.
- Prioritize interventions by impact-to-effort ratio. A CRM field cleanup that takes two days and recovers $80K in pipeline visibility ranks above a territory redesign that takes three months and recovers $90K. Speed of recovery matters as much as size.
- Deploy targeted interventions with owners, deadlines, and success metrics defined before work begins. Vague interventions produce vague results. Each gap gets one owner, one metric, and one deadline.
- Set a monitoring cadence and stick to it. Weekly reviews work for high-growth SaaS clients where pipeline moves fast. Monthly reviews suit professional services firms with longer sales cycles. AI-powered platforms enable continuous monitoring and earlier intervention, replacing the manual spreadsheet reviews that most consulting teams still rely on.
Gap analysis works best when it connects measurements to meaningful business units and incorporates cadence-based review for ongoing alignment. The cadence is not optional. Without it, gaps that were closed in month one quietly reopen in month four, and the client assumes the consulting engagement failed.
Key takeaways
Consultants who identify client revenue gaps most effectively combine stakeholder alignment, funnel forensics, and financial auditing into a single repeatable diagnostic cycle with defined monitoring cadence.
| Point | Details |
|---|---|
| Start with definitions, not data | Audit every team's KPI definitions before pulling a single report to eliminate metric conflicts. |
| Classify gaps by type | Planning, execution, forecasting, and collection gaps each require different interventions. |
| Quantify revenue at risk | Use the formula Unworked Leads × Conversion Rate × Deal Value to make leakage tangible. |
| Audit cash flow alongside pipeline | AR aging and 13-week forecasts reveal collection gaps that pipeline reports hide entirely. |
| Build a monitoring cadence | Monthly reviews for high-growth clients and quarterly for mature ones prevent gaps from reopening. |
Why most consultants stop too soon
I have reviewed dozens of revenue gap engagements over the years, and the pattern is consistent. The consultant pulls pipeline data, identifies a coverage ratio problem, recommends more prospecting activity, and closes the engagement. The client sees a temporary lift and then slides back within two quarters. The root cause was never touched.
The uncomfortable truth is that most revenue gaps are not sales problems. They are definition problems. When marketing counts a webinar registrant as an MQL and sales counts only a booked demo, the handoff gap between those two definitions can represent hundreds of thousands of dollars in unworked leads annually. No amount of prospecting activity fixes a definition problem.
The other mistake I see consistently is treating pipeline totals as a reliable signal. Pipeline totals may mask inflated late-stage opportunities caused by reward systems that incentivize stage progression over deal quality. A $4M pipeline that is 70% late-stage sounds healthy until you realize that half those deals have been in "Negotiation" for 60 days with no documented next step. That is not a pipeline. That is a wish list.
The consultants who deliver durable results treat every engagement like a forensic investigation. They follow the money from first touch to collected cash, document every handoff, and quantify every leak. AI diagnostics in consulting are accelerating this process significantly in 2026, but the underlying logic is the same. Find where the money stops moving, figure out why, and fix the system rather than the symptom.
— Bernard
Detect revenue gaps faster with Signalengine
Consultants who want to move from manual spreadsheet reviews to AI-powered gap detection can put Signalengine to work immediately. The platform scores leads by buy-readiness in real time, flags churn risk before it shows up in churn data, and surfaces pipeline leakage across the entire funnel without requiring weeks of onboarding.

Signalengine's revenue intelligence tools complement every diagnostic framework covered in this article. You get automated outreach, real-time lead scoring, and a 30-day recovery playbook built directly into the platform. Clients using Signalengine see an average recovery potential of $38K in the first month. See it in action with the live demo and find out exactly where your client's revenue is leaking right now.
FAQ
What is revenue gap analysis in consulting?
Revenue gap analysis is the structured process of identifying the difference between a client's actual revenue and its full attainable potential by diagnosing planning, execution, forecasting, and collection gaps. It combines stakeholder mapping, funnel diagnostics, and financial auditing into a repeatable framework.
How do consultants calculate revenue at risk?
Revenue at Risk is calculated by multiplying unworked leads by the historical lead-to-revenue conversion rate and average deal value. This formula converts an operational problem into a dollar figure that drives executive attention and prioritization.
Why do revenue gaps persist after a consulting engagement?
Revenue gaps reopen when the root cause is a metric definition conflict or incentive misalignment rather than a sales activity problem. Without a continuous monitoring cadence and a unified KPI glossary, the same structural issues resurface within one to two quarters.
How often should revenue gap analysis be performed?
High-growth companies benefit from monthly gap reviews, while mature organizations can operate effectively on a quarterly cadence. AI-powered platforms now enable continuous monitoring that catches variances before they compound into structural misses.
What financial reports are most useful for identifying revenue gaps?
AR aging reports segmented by customer and a 13-week rolling cash flow forecast are the two most revealing financial documents. Together, they expose timing mismatches between recognized revenue and collected cash that pipeline reports never surface.
Ready to Stop the Revenue Leak?
Signal Engine gives small and local businesses 31 AI-powered tools to score leads by buying intent, predict churn before it happens, auto-generate email and SMS campaigns, and recover missed calls automatically — all in one dashboard starting at $49/month.
Start your free 7-day trial — no credit card required. Setup takes 5 minutes.