
TL;DR:
- At-risk revenue signals forecast potential future losses using CRM, support, billing, and product data before actual churn occurs. Properly quantifying and prioritizing these signals with a probability-impact-time model enables proactive account management and quicker interventions. Successful risk mitigation depends on unified data, assigned ownership, and structured response playbooks across teams.
At-risk revenue is defined as the portion of forecasted or committed future revenue that shows measurable instability signals before churn, downgrade, non-renewal, or payment failure actually hits your reported results. It is not lost revenue yet. It is revenue that is sending you warning signs right now, through your CRM, product usage data, support tickets, and billing behavior, giving you a window to act before the loss becomes permanent. Platforms like Signalengine, HubSpot, and Salesforce all surface versions of these signals, but most businesses only see the damage after the financial variance report lands. Understanding at-risk revenue means closing that gap.
What is at-risk revenue and why does it matter?
At-risk revenue is the portion of forecasted or committed future revenue that shows measurable instability signals before churn or payment failures actually hit reported results. The signals derive from CRM activity, customer success and product usage data, support ticket severity, and billing behavior combined. This definition matters because it shifts your focus from reactive loss accounting to proactive risk detection.
Most revenue managers treat churn as a past-tense event. A customer cancels, the ARR drops, the team does a post-mortem. At-risk revenue reframes the problem entirely. The instability was visible weeks or months earlier. The question is whether your systems were watching.
The business case is straightforward. Retaining an existing customer costs significantly less than acquiring a new one, and every dollar of at-risk revenue you recover goes straight to the bottom line. For SMBs operating on tighter margins, catching these signals early is not a nice-to-have. It is a survival skill.
What signals indicate revenue is at risk?
Common drivers of revenue instability include declining product usage, unresolved high-severity support tickets near renewal, unpaid invoices, single-product usage among multi-product customers, and stalled contract expansions. Each of these signals is measurable, and each points to a different type of risk with a different urgency level.
Here is how the most important signal categories break down:
- Declining product usage: A customer who logged in daily and now logs in weekly is disengaging. In SaaS, this is one of the strongest predictors of non-renewal.
- High-severity support tickets: Unresolved technical issues near a renewal window create frustration that converts to churn. The ticket is not just a support problem. It is a revenue signal.
- Unpaid or disputed invoices: Billing friction is often the first visible sign of a customer reconsidering the relationship. It shows up in your billing system before it shows up in your CRM.
- Stalled expansions: A customer who paused an upsell conversation or stopped responding to expansion outreach is signaling reduced commitment.
- Behavioral deal signals: Declining buyer responsiveness, shifting meeting attendance, and resurfacing objections are detectable two to four weeks before deal loss. This applies to both renewals and new pipeline.
The challenge is that these signals live in separate systems. Your CRM holds engagement data. Your support platform holds ticket history. Your billing system holds payment status. Without integration, you are reading one chapter of a book and calling it the whole story.
Pro Tip: Set up a weekly cross-system review that pulls CRM engagement scores, open support tickets, and overdue invoices into a single view. Even a manual spreadsheet beats waiting for the variance report.
How is at-risk revenue quantified and prioritized?
A revenue at risk radar quantifies risk as Probability × Impact × Time-to-impact, using time horizons like 30, 60, and 90 days for churn and shorter windows for payment failure. This formula transforms vague concern into a number your finance team and RevOps team can act on together.

Here is what each dimension means in practice:
| Dimension | Definition | Example |
|---|---|---|
| Probability | Likelihood the revenue will be lost | 70% churn probability based on usage decline |
| Impact | Dollar value of the revenue at stake | $18,000 ARR contract |
| Time-to-impact | Days until the risk becomes a realized loss | 45 days to renewal date |
| Risk Score | Probability × Impact × Time weighting | Prioritizes urgent, high-value accounts first |
This approach beats simple churn labels like "red/yellow/green" because it gives you a ranked list of accounts by financial exposure, not just a color. A $500 account at 90% churn probability ranks below a $20,000 account at 40% churn probability with 30 days to renewal. The math makes that prioritization automatic.
Proper time-to-impact window selection improves detection accuracy by aligning failure mode horizons with intervention timing. Churn risk warrants a 60-day window. Payment failure warrants a 14-day window. Using the same horizon for both creates false urgency in one case and missed urgency in the other.
Treating at-risk revenue as a probability-weighted exposure with timelines enables finance and RevOps to have data-driven conversations about risk exposure and mitigation timing, rather than arguing about whether an account "feels" healthy.
Pro Tip: Segment your at-risk revenue by failure mode before you prioritize. Churn risk, downgrade risk, and payment failure risk each require different playbooks and different response timelines.
What strategies effectively manage and reduce at-risk revenue?
Managing at-risk revenue requires a structured framework for deciding which accounts to save and how. At-risk customer management involves assessing saveability across five dimensions: product fit, problem fixability, customer willingness, economic feasibility, and overall business benefit. Not every flagged account is worth saving. Applying this filter before you deploy resources prevents wasted effort on accounts that will churn regardless.
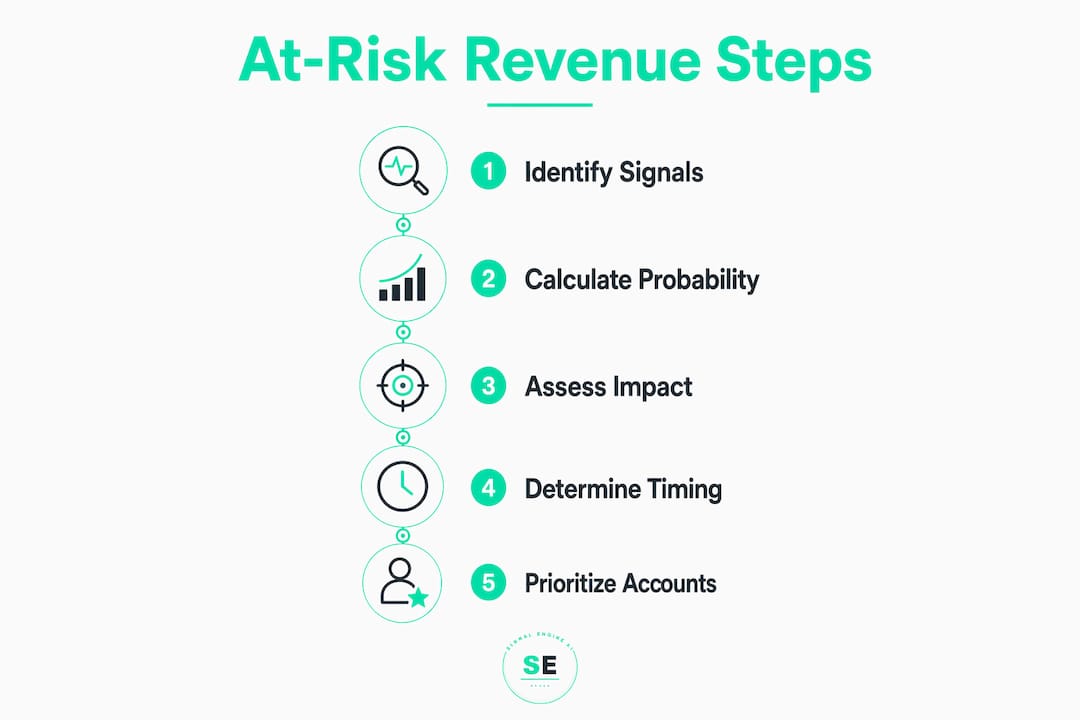
Here is a practical sequence for working through at-risk accounts:
- Identify and score. Pull all accounts with active risk signals into a prioritized list using your probability-weighted risk score. Focus on accounts where the math justifies intervention.
- Assess saveability. For each high-priority account, ask: Is the product a genuine fit for their current needs? Is the problem causing dissatisfaction fixable? Is the customer willing to engage? Does the cost of saving them justify the lifetime value recovered?
- Assign ownership. Every at-risk account needs a named owner with a deadline. A risk score without accountability is just a dashboard. A risk score without operational follow-up and playbooks is ineffective.
- Execute the right playbook. Match the intervention to the signal type. Declining usage calls for a product adoption campaign or a success check-in call. An unpaid invoice calls for billing dispute resolution, not a renewal pitch. A stalled expansion calls for an executive sponsor conversation.
- Measure save rate and ROI. Track which interventions work. The Save ROI formula is: (Account LTV × Save Probability) minus Save Cost. This tells you whether your retention spend is generating returns or just generating activity.
Saving at-risk customers depends on rapidly validating whether the problem is fixable and worth the investment, rather than applying uniform remedies to all flagged accounts. Uniform outreach burns your team's time and trains customers to expect concessions they did not need.
A CRM's role in customer retention is critical here. CRM data integration is what makes it possible to surface instability signals early enough to act. Without it, your intervention arrives after the customer has already decided to leave.
How does customer concentration affect revenue risk?
Customer concentration is a specific and often underestimated factor in at-risk revenue analysis. Revenue at risk from top customers is calculated as the percentage of revenue from a top customer multiplied by total revenue, with over 10% from a single customer often considered material risk. A company growing 20% year-over-year can still see net revenue decline if it loses a customer representing 30% of sales.
This is the scenario that blindsides leadership teams. The growth metrics look healthy until one large account churns, and then the entire revenue picture shifts. Concentration risk is invisible in aggregate dashboards but obvious in customer-level analysis.
Beyond the percentage threshold, these are the diagnostic questions that matter:
- Contract length and renewal health: A large customer on a three-year contract with strong usage is structurally different from the same customer on a month-to-month agreement with declining logins.
- Payment status: Is the large customer current on invoices? Slow payment from a top account is a concentration risk amplifier.
- Geographic and product diversity: If your top customer represents your only foothold in a specific region or product line, their departure creates a gap that is harder to fill than the revenue number alone suggests.
- Stakeholder stability: Has the champion who bought your product left the company? Executive turnover at a top account is a leading indicator of churn risk.
Customer concentration as a risk measure is most valuable when it prompts qualitative analysis of renewal health and payment behavior, rather than serving as a standalone numeric threshold. The number tells you where to look. The qualitative review tells you what you are actually dealing with.
For revenue managers, the practical output of concentration analysis is a short list of accounts that warrant deeper monitoring and faster intervention timelines. These accounts should have dedicated owners, shorter check-in cycles, and explicit renewal health scores tracked in your revenue dashboard.
Key takeaways
At-risk revenue is a signal visibility problem, and the businesses that solve it earliest protect the most revenue.
| Point | Details |
|---|---|
| Define it precisely | At-risk revenue is forecasted revenue showing instability signals before actual loss events occur. |
| Unify your signals | CRM, support, billing, and product usage data must be combined to detect risk accurately. |
| Quantify with a formula | Use Probability × Impact × Time-to-impact to rank accounts by financial exposure, not just status color. |
| Assess saveability first | Not every flagged account is worth saving. Filter by product fit, fixability, and economics before acting. |
| Watch concentration risk | Any customer representing more than 10% of revenue warrants dedicated monitoring and faster intervention timelines. |
The signal visibility problem nobody talks about enough
I have worked with revenue teams across industries, and the pattern is almost always the same. The data exists. The signals were there. The loss was preventable. What failed was not the technology. It was the organizational habit of waiting for the variance report before taking the problem seriously.
Revenue at risk is fundamentally a signal visibility problem. Without data unification, revenue risk only becomes visible after the financial variance report. By then, the customer has already made their decision. You are not managing risk at that point. You are managing damage.
The second failure I see consistently is the risk score that lives in a dashboard and goes nowhere. Teams spend weeks building scoring models, celebrate the launch, and then watch the scores update every Monday while nobody acts on them. A score without a named owner, a defined playbook, and a response SLA is not a risk management system. It is a reporting system dressed up as one.
The fix is not complicated, but it requires discipline. Every risk score above your threshold needs an owner assigned within 24 hours. Every owner needs a playbook that matches the signal type. Every playbook needs a deadline. That structure is what separates teams that recover revenue from teams that document why they lost it.
The businesses I have seen do this well share one trait. They treat at-risk revenue detection as a cross-functional responsibility, not a customer success problem. Finance, RevOps, sales, and support all own a piece of the signal. When those teams share a single view of account health, the response time drops and the save rate goes up. It is that direct.
— Bernard
How Signalengine detects at-risk revenue before it disappears
Your revenue signals are already there. Signalengine's AI-powered revenue intelligence platform watches your customers automatically, scores their behavior in real time, and flags who is about to leave before they do. No manual data pulls. No waiting for the variance report.
Signalengine connects your customer signals into one dashboard, giving you a prioritized list of accounts at risk with the context you need to act fast. Built for SMBs across 12 verticals including HVAC, logistics, dental, real estate, and more. Pricing starts at $49/month because protecting your revenue should not require an enterprise budget. You can also explore churn prediction tools purpose-built for small business teams who need early warnings, not just reports.
Ready to Stop the Revenue Leak?
Signal Engine gives small and local businesses 31 AI-powered tools to score leads by buying intent, predict churn before it happens, auto-generate email and SMS campaigns, and recover missed calls automatically — all in one dashboard starting at $49/month.
Start your free 7-day trial — no credit card required. Setup takes 5 minutes.
FAQ
What is the at-risk revenue definition in simple terms?
At-risk revenue is forecasted or committed revenue that shows early warning signals of instability before churn, downgrade, or payment failure is recorded. It is revenue you still have but may lose if you do not act on the signals now.
What are common at-risk revenue examples?
Common examples include a SaaS customer with declining login frequency approaching renewal, an account with an unresolved high-severity support ticket, a client with an overdue invoice, and a large customer who paused an upsell conversation without explanation.
How do you calculate at-risk revenue exposure?
The standard formula is Risk = Probability × Impact × Time-to-impact. Multiply the likelihood of loss by the dollar value at stake, then weight it by how soon the risk window closes to prioritize the accounts that need attention first.
How does customer concentration increase revenue risk?
When a single customer represents more than 10% of total revenue, losing that account can offset growth across the rest of your portfolio. Concentration risk requires deeper monitoring of renewal health, payment status, and stakeholder stability beyond the revenue percentage alone.
How do you manage at-risk revenue effectively?
Effective management requires three things working together: unified signals from CRM, billing, and product usage data; a probability-weighted risk score that ranks accounts by financial exposure; and named account owners with defined playbooks and response deadlines attached to every flagged account.