

TL;DR:
- The SaaS Quick Ratio measures how efficiently subscription businesses grow by comparing revenue inflows to outflows. A ratio above 4.0 indicates strong growth efficiency, but trend consistency and additional metrics are essential for full assessment. It is primarily a diagnostic tool that should be paired with unit economics and retention data for accurate insights.
The SaaS Quick Ratio measures how efficiently your subscription business grows by dividing revenue inflows (New MRR + Expansion MRR) by revenue outflows (Churned MRR + Contraction MRR). A ratio of 4.0 or higher is commonly cited by SaaS investors as an indicator of strong growth efficiency, though context and stage matter significantly. Per The SaaS CFO, treat it as a directional metric, not a verdict.
Note: the SaaS Quick Ratio is a growth-efficiency metric specific to subscription businesses. It shares a name with the traditional acid-test quick ratio from corporate finance, which measures short-term liquidity using balance sheet assets. They are entirely different calculations.
Table of Contents
- Worked examples that show the math clearly
- What counts as a good Quick Ratio by stage?
- What the Quick Ratio misses and where it misleads you
- How investors and leaders use the Quick Ratio in practice
- How to build a Quick Ratio calculator in Excel or Google Sheets
- Key Takeaways
- The Quick Ratio tells you where to look, not what to do
- Signalengine turns Quick Ratio signals into revenue actions automatically
- FAQ
- Ready to Stop the Revenue Leak?
Worked examples that show the math clearly
These two scenarios use the same total new MRR but produce very different Quick Ratios, which is exactly the point.
Scenario A: Healthy expansion, low churn
- New MRR: $18,000
- Expansion MRR: $7,000
- Churned MRR: $4,000
- Contraction MRR: $2,000
- Quick Ratio = (New MRR + Expansion MRR) divided by (Churned MRR + Contraction MRR), illustrating how the metric is calculated
A ratio of 4.17 clears the commonly cited 4.0 threshold. Your expansion engine is working, and churn is contained.
Scenario B: Strong new MRR, high contraction and churn
- New MRR: $18,000
- Expansion MRR: $3,000
- Churned MRR: $9,000
- Contraction MRR: $5,000
- Quick Ratio calculation shows lower ratio when contraction and churn are high relative to new and expansion MRR
A ratio of 1.50 signals a leaky bucket. You're spending to acquire customers faster than you're retaining them. The new MRR looks impressive in isolation; the Quick Ratio exposes the problem.
Converting to ARR: Multiply each MRR figure by 12 to get annualized equivalents. Scenario A becomes $300,000 in annualized inflows versus $72,000 in annualized outflows. Monthly granularity is still preferable for spotting trends early — annual snapshots smooth over the month where churn spiked.
What counts as a good Quick Ratio by stage?
A commonly cited benchmark is 4.0 or higher for growth-stage SaaS. Below is a practical interpretation table based on directional guidance from industry analysts.
| Quick Ratio Range | What It Signals | Typical Investor Reaction |
|---|---|---|
| Below 1.0 | Revenue is shrinking; outflows exceed inflows | High concern; fundraising is very difficult |
| 1.0–2.0 | Marginal growth; churn is eroding new revenue fast | Skepticism; needs strong unit-economics story |
| 2.0–4.0 | Moderate growth efficiency; acceptable at early stage | Watchful; investors want to see improvement trend |
| Above 4.0 | Strong growth efficiency; expansion and retention working | Positive signal; supports growth-stage valuations |
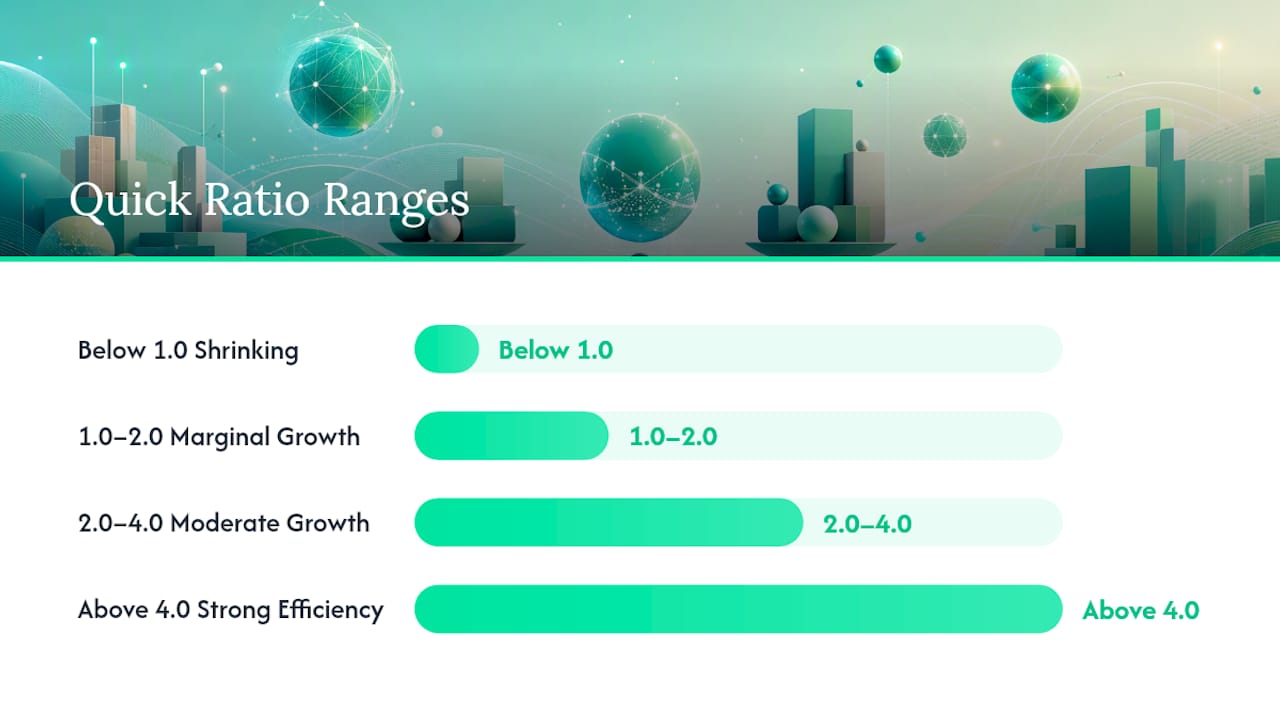
Stage sensitivity matters. A seed-stage company at $50K ARR with a ratio of 2.5 is in a different position than a Series B company at $5M ARR with the same number. Stripe notes that investors focus on trend consistency over single-period readings, so a ratio climbing from 2.0 to 3.5 over six months often reads better than a flat 4.0.
As ARR scales past $20M–$30M, enterprise contract dynamics shift the metric's relevance. Annual renewals, multi-year deals, and negotiated expansions make monthly MRR movements noisier. At that stage, Gross Revenue Retention (GRR) and Net Revenue Retention (NRR) often carry more weight in investor conversations.
What the Quick Ratio misses and where it misleads you
The Quick Ratio is a growth-efficiency signal, not a full health report. Relying on it alone creates blind spots.
Main blind spots:
- Acquisition cost: A ratio of 5.0 built on $500 CAC is very different from one built on $5,000 CAC. The metric never tells you what you paid to generate that New MRR.
- Margin impact: Expansion MRR from a heavily discounted upsell looks identical to full-price expansion. Gross margin differences are invisible here.
- One-time revenue: Implementation fees, professional services, or one-time charges can inflate New MRR if your billing system doesn't separate them.
- Seasonality: A SaaS business with strong Q4 enterprise closes will show a high ratio in December and a weak one in January. Neither reading reflects the underlying trend.
Common calculation pitfalls:
- Including reactivations in some months but not others
- Misaligning periods (using January churn against February new MRR)
- Double-counting upgrades as both Expansion MRR and New MRR
- Billing system bugs that report annual prepayments as a single month's New MRR
Standard finance principles reinforce what SaaS practitioners learn the hard way: single-ratio readings need trend context and industry comparison to mean anything. The Wikipedia entry on quick ratios also highlights how naming overlap between the liquidity quick ratio and the SaaS version creates confusion in cross-functional discussions.
Pro Tip: Run a 3-month rolling median alongside your monthly Quick Ratio. A single bad month from a billing glitch won't distort your trend line, and a genuine retention problem becomes visible within two periods instead of four.
How investors and leaders use the Quick Ratio in practice
The Quick Ratio earns its place in diligence and operating reviews when paired with companion metrics that fill its blind spots.
Companion metrics to track alongside it:
- CAC Payback Period: How many months to recover customer acquisition cost. A high Quick Ratio with a 36-month CAC payback signals growth that's expensive to sustain.
- Burn Multiple: Net burn divided by net new ARR. Tells you how much cash you're spending per dollar of new revenue. Pair this with Quick Ratio to separate efficient growth from cash-intensive growth.
- LTV:CAC: Lifetime value relative to acquisition cost. A Quick Ratio above 4.0 with an LTV:CAC below 3:1 means your retention is good but your acquisition economics are weak.
- Gross Revenue Retention (GRR): Measures how much revenue you keep from existing customers, excluding expansion. A strong Quick Ratio driven entirely by New MRR with weak GRR is a warning sign.
- Net Revenue Retention (NRR): Includes expansion. NRR above 100% means existing customers are growing their spend faster than others are churning.
Stripe's SaaS metrics guide recommends pairing Quick Ratio with CAC-to-LTV and CAC payback to determine whether growth is fast and efficient or fast and expensive.
Comparison: healthy vs. risky growth patterns
| Signal | Healthy Pattern | Risky Pattern |
|---|---|---|
| Quick Ratio | Above 4.0, trending up | Above 4.0, but declining month-over-month |
| CAC Payback | Under 18 months | Over 30 months |
| Burn Multiple | Below — | Above 3x |
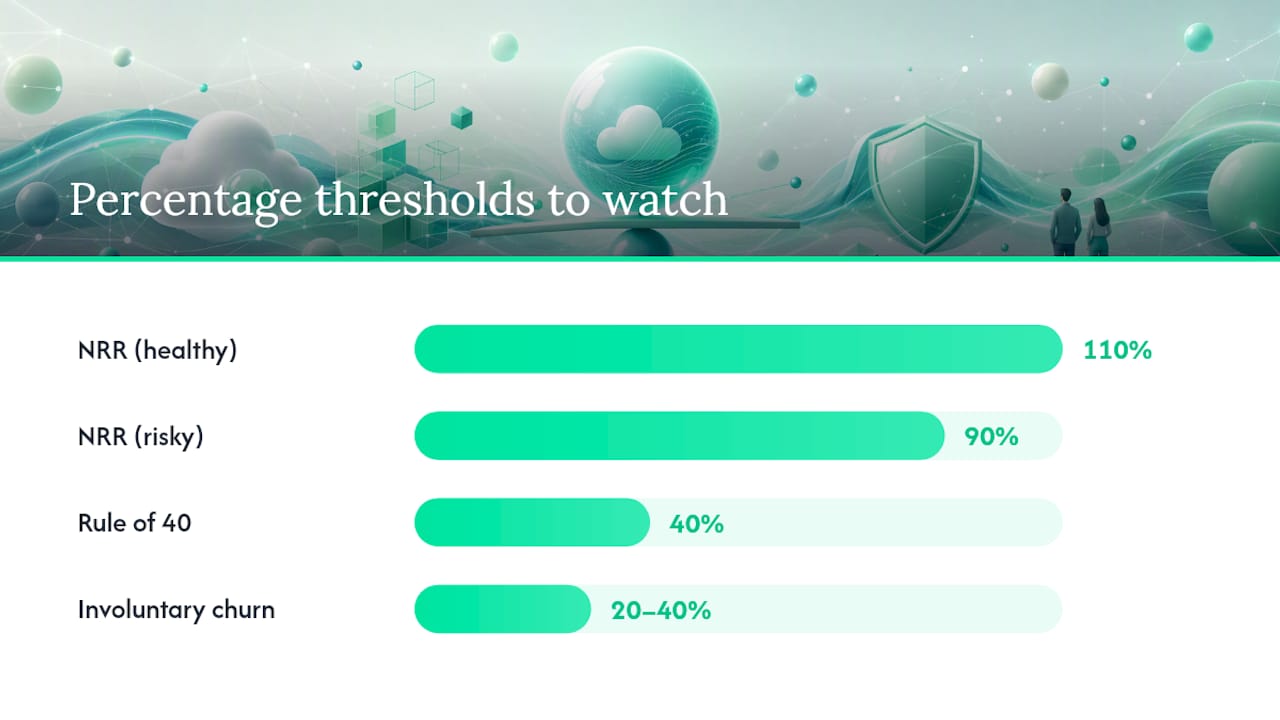
| NRR | Above 110% | Below 90% |
30-day action checklist when your Quick Ratio is low:
- Isolate which cohort is driving the most Churned MRR — segment by acquisition channel, plan tier, and customer age.
- Check Contraction MRR separately. Downgrades often signal pricing friction or feature gaps before full cancellation hits.
- Audit your involuntary churn sources — failed payments alone can account for 20–40% of total churn in SMB SaaS.
- Launch a targeted retention sequence for at-risk accounts using behavioral signals, not just billing status.
- Test one expansion play: a usage-based upsell prompt, a seat-add campaign, or a plan-upgrade offer to active power users.
- Review pricing for your highest-contraction cohort. Contraction often precedes churn by 60–90 days.
Pro Tip: Investors reviewing SEC filings and public SaaS disclosures look for trend consistency over 6–12 months, not a single strong quarter. A Quick Ratio that climbs steadily from 2.5 to 4.0 over eight months tells a more compelling story than a one-time spike.
The Rule of 40 is a useful companion heuristic during investor evaluation: your revenue growth rate plus your profit margin should equal or exceed 40%. A company clearing the Rule of 40 with a Quick Ratio above 4.0 has a strong dual signal for both growth efficiency and profitability balance.
How to build a Quick Ratio calculator in Excel or Google Sheets
Set up one row per month with these columns:
- Column A: Month (e.g., January 2026)
- Column B: New MRR
- Column C: Expansion MRR
- Column D: Contraction MRR
- Column E: Churned MRR
- Column F: Quick Ratio
=(B2+C2)/(D2+E2) - Column G: 3-Month Rolling Median
=MEDIAN(F2:F4)(drag down as rows accumulate)
For ARR-based calculation, multiply each MRR cell by 12 before dividing, or add a separate ARR column: =(B2*12+C2*12)/(D2*12+E2*12). The ratio itself is identical — the multiplication cancels out — but ARR columns make board reporting easier.
Automation tips:
- Connect your billing system (Stripe, Chargebee, Recurly) to a Google Sheet via Zapier or a native export. Schedule a monthly pull so the MRR columns populate automatically.
- Use conditional formatting on Column F: red for values below 2.0, yellow for 2.0–4.0, green for above 4.0. You'll spot problems at a glance.
- Add a sparkline in Column H to visualize the 12-month trend without building a separate chart.
Pro Tip: If you want the MRR movement data to populate without manual entry, Signalengine's revenue intelligence platform auto-detects churn signals and surfaces expansion opportunities from your customer behavior data — feeding the inputs your Quick Ratio calculator needs before you even think to ask.
Key Takeaways
The SaaS Quick Ratio is a directional growth-efficiency metric: a ratio above 4.0 signals strong subscription health, but trend consistency and companion metrics like CAC payback and Burn Multiple determine whether that number actually means your business is built to last.
| Point | Details |
|---|---|
| Core formula | Divide New MRR + Expansion MRR by Churned MRR + Contraction MRR each month. |
| Directional benchmark | A ratio above 4.0 is widely cited as strong; below 2.0 warrants immediate retention focus. |
| Consistency is critical | Never change MRR category definitions mid-trend without recalculating all historical values. |
| Pair with unit economics | Always check CAC payback, Burn Multiple, and NRR alongside the Quick Ratio for a complete picture. |
| Signalengine automates inputs | Signalengine detects churn signals and expansion opportunities automatically, keeping your Quick Ratio data current. |
The Quick Ratio tells you where to look, not what to do
The metric gets oversold as a growth scorecard. It's really a diagnostic pointer.
A Quick Ratio above 4.0 with a Burn Multiple of 4.0x is not a healthy business. A Quick Ratio of 2.8 with NRR at 115% and a 14-month CAC payback is a business worth backing. The number alone doesn't tell you which one you're looking at.
What I find most useful about the Quick Ratio in SMB SaaS contexts is its sensitivity to contraction MRR, which most founders ignore until it's too late. Churned MRR is visible and painful. Contraction MRR is quiet. Customers downgrade, remove seats, or negotiate discounts, and the Quick Ratio catches that erosion months before full cancellations spike. Running a renewal rate improvement workflow against your lowest-ratio cohorts is often more valuable than chasing new logo growth.
Track it monthly. Pair it with cohort retention data. And when the ratio dips two months in a row, don't wait for month three to act.
Signalengine turns Quick Ratio signals into revenue actions automatically
Calculating the Quick Ratio is step one. Acting on it fast enough to matter is where most SaaS teams fall short.

Signalengine's AI-powered revenue intelligence platform watches your customer behavior in real time, scores accounts by churn risk and expansion potential, and fires automated email and SMS campaigns before a contraction becomes a cancellation. Your MRR movement data stays current without manual exports, and your team gets a prioritized list of who to call, what to offer, and when to act.
For SaaS teams that want to see the Quick Ratio and churn signals automated inside a live dashboard, book a demo and see it running on your own data in under 30 minutes.
FAQ
What is a good SaaS Quick Ratio?
A ratio of 4.0 or higher is widely cited as an indicator of strong growth efficiency for SaaS. Ratios between 2.0 and 4.0 are acceptable at early stages, while anything below 1.0 means revenue is actively shrinking.
What is the Rule of 40 for SaaS?
The Rule of 40 states that a SaaS company's revenue growth rate plus its profit margin should equal or exceed 40%. It's a profitability-and-growth heuristic that pairs well with the Quick Ratio during investor evaluation.
What is the 3-3-2-2-2 rule in SaaS?
The 3-3-2-2-2 rule is a growth-rate benchmark suggesting that top-performing SaaS companies triple revenue in years one and two, then double it in years three, four, and five. It's a directional target, not a universal standard, and definitions vary across sources.
What is the golden ratio for SaaS?
"Golden ratio" is not a standardized SaaS term. In practice, investors often treat a Quick Ratio above 4.0 combined with NRR above 110% as a strong dual signal for subscription health, though no single universal golden ratio exists across all stages and business models.
Ready to Stop the Revenue Leak?
Signal Engine gives small and local businesses 31 AI-powered tools to score leads by buying intent, predict churn before it happens, auto-generate email and SMS campaigns, and recover missed calls automatically — all in one dashboard starting at $49/month.
Start your free 7-day trial — no credit card required. Setup takes 5 minutes.