

Customer satisfaction is a multi-level construct that measures how well your product, service, and overall experience meet customer expectations. It operates at the individual, firm, and industry levels, and systematically managed, it's one of the most direct predictors of retention, revenue, and long-term growth your business has. Before you read another word, here are three moves you can make right now:
- Measure at the moment of truth. Send a transactional CSAT survey within 24 hours of a key interaction, not a week later when the memory fades.
- Track both CSAT and NPS. CSAT tells you what happened at a specific touchpoint; NPS tells you how the relationship is trending. You need both.
- Close the loop fast. Assign an owner to every low score and set a 48-hour SLA for follow-up. The feedback loop that never closes is the one that costs you customers.
This guide translates those three moves into a full operational system — from metric selection and survey design to driver diagnosis, improvement checklists, and executive reporting.
Key Takeaways
Customer satisfaction is a strategic organizational resource — not just a survey score — and the businesses that treat it that way consistently outperform on retention, revenue, and brand resilience.
| Point | Details |
|---|---|
| Measure at the right moment | Send transactional CSAT within 24 hours of an interaction for accurate, actionable data. |
| Use CSAT, NPS, and CES together | Each metric answers a different question; combining them gives you a complete picture of experience quality. |
| Close-loop rate is the key health metric | A high close-loop rate predicts score improvement better than response volume alone. |
| Tie targets to revenue outcomes | Translate a CSAT lift into expected retention and revenue impact to earn executive buy-in. |
| Signalengine automates the action step | Signalengine scores customer behavior, flags churn risk, and routes alerts so no low score goes unaddressed. |
Table of Contents
- What customer satisfaction actually measures (and what it doesn't)
- Why customer satisfaction drives revenue, retention, and brand strength
- How to build a measurement plan that actually works
- CSAT, NPS, and CES: which metric answers which question
- How to set targets that connect to business outcomes
- What actually drives satisfaction scores
- Practical steps to raise your satisfaction scores
- Sample survey questions and templates you can use today
- Customer satisfaction as a strategic resource: what the research says
- Which tools should you use for measurement and analysis?
- What most guides get wrong about satisfaction programs
- Ready to Stop the Revenue Leak?
- Sources
- FAQ
- Ready to Stop the Revenue Leak?
What customer satisfaction actually measures (and what it doesn't)
Customer satisfaction is the degree to which a product, service, or experience meets a customer's expectations. That sounds simple. The operational reality is more layered.
Researchers describe satisfaction as a multi-level construct: at the micro level, it reflects an individual's reaction to a single interaction; at the meso level, it aggregates into a firm's overall satisfaction score; at the macro level, it shapes industry-wide benchmarks and correlates with market outcomes. Most businesses measure only the micro level and wonder why their scores don't move the revenue needle.
The mechanism behind satisfaction is called the disconfirmation model: a customer enters an interaction with an expectation, experiences the reality, and compares the two. When reality exceeds expectation, satisfaction rises. When it falls short, dissatisfaction sets in. The sequence looks like this:
Expectation → Experience → Comparison → Satisfaction → Behavior (repurchase, referral, churn)
Two misconceptions trip up even experienced teams:
- Satisfaction equals loyalty. It doesn't. A satisfied customer can still leave if a competitor offers better value. Loyalty requires consistently exceeding expectations, not just meeting them.
- Surveys are a strategy. Sending a survey is data collection. A strategy is what you do with the data. Most programs fail at the second part, not the first.
Why customer satisfaction drives revenue, retention, and brand strength
Poor satisfaction is expensive. Qualtrics research links CX improvements to material revenue gains and lower cost-to-serve, with the compounding effect growing over multiple years. The mechanism is straightforward: satisfied customers buy again, refer others, and require less support.
Here's how satisfaction maps to commercial outcomes:
- Retention: Customers who rate their experience highly are significantly more likely to renew, reorder, or return. Reducing churn by even a small percentage compounds into substantial lifetime value gains.
- Referral and acquisition cost: A satisfied customer who recommends your business is worth far more than any paid ad. Word-of-mouth from happy customers lowers your cost to acquire the next one.
- Revenue per customer: Satisfied customers are more open to upsells and cross-sells. They trust you enough to expand the relationship.
- Brand resilience: When something goes wrong, customers with a history of positive experiences are more forgiving. They give you a chance to recover rather than leaving immediately.
📊 Stat to know: SmartSurvey's framework notes that organizations that close feedback loops consistently see measurable changes in satisfaction scores within 1–3 months of implementation.
One often-overlooked driver: employee satisfaction. Teams that feel supported and engaged deliver better service. The link between employee experience and customer experience is well-documented — unhappy frontline staff produce inconsistent, low-energy interactions that customers notice immediately. Investing in your people is a direct investment in your scores.
For SaaS businesses specifically, satisfaction improvements translate directly into renewal rate gains — one of the clearest financial signals that your CX work is paying off.
How to build a measurement plan that actually works
Most teams skip straight to picking a survey tool. That's the wrong starting point. A replicable measurement workflow starts with objectives and ends with action, not data collection.
The SIGNAL framework — Scope, Inputs, Gather, Notify, Act, Learn — gives you a structured operating model for building a customer feedback strategy that names owners at every stage and measures program health with three metrics: response rate, time-to-insight, and close-loop rate.
Step-by-step measurement workflow
- Scope: Define what question you're answering. Are you measuring satisfaction with a specific touchpoint (transactional) or the overall relationship (relational)?
- Inputs: Identify which channels and moments generate the most signal — post-purchase, post-support, onboarding completion, renewal.
- Gather: Deploy the right instrument at the right moment (see the timing table below).
- Notify: Route low scores to the right owner within hours, not days.
- Act: Close the loop with the customer. This is the step most programs skip.
- Learn: Aggregate findings into themes, update your product or process, and re-measure the same cohort.
Survey timing: which instrument fits which moment
| Moment | Best instrument | Primary question |
|---|---|---|
| Post-support interaction | Transactional CSAT | "How satisfied were you with this interaction?" |
| Post-purchase / onboarding | CES | "How easy was it to complete this process?" |
| Quarterly relationship check | Relationship NPS | "How likely are you to recommend us?" |
| Product feature release | Transactional CSAT | "How well did this feature meet your needs?" |
| Annual account review | Relationship NPS + open text | "What would make you more likely to recommend us?" |
Sampling, response rates, and bias controls
Survey timing matters as much as question design. Delivery timing for satisfaction surveys impacts data quality; transactional surveys sent promptly after interaction yield more accurate feedback.
Response rates vary by channel and industry. Survey response rates vary by channel; in-app and SMS surveys often achieve higher engagement than email. To control for bias, avoid surveying only your most engaged customers — that produces inflated scores that don't reflect your full customer base. Rotate your sample across cohorts, and always include a segment of recently churned or lapsed customers to capture the signal you're most likely missing.
Pro Tip: Track your close-loop rate as a program health metric, not just your CSAT score. A program with a 40% response rate and a 90% close-loop rate outperforms one with a 70% response rate and a 10% close-loop rate every time. The act step is where satisfaction programs earn their ROI.
CSAT, NPS, and CES: which metric answers which question
These three metrics are often treated as interchangeable. They're not. Each answers a different question, and using the wrong one for the wrong moment produces misleading data.
CSAT (Customer Satisfaction Score)
What it measures: Satisfaction with a specific interaction or touchpoint.
How to calculate it:
CSAT is calculated as the proportion of satisfied responses relative to total responses, expressed as a percentage
A "satisfied" response is typically a 4 or 5 on a 5-point scale. If most respondents rate their experience positively (e.g., 4 or 5 on a scale), the CSAT reflects that majority satisfaction.
When to use it: Post-support tickets, post-purchase, post-onboarding. Any moment where you want to evaluate a discrete interaction.
NPS (Net Promoter Score)
What it measures: Overall relationship strength and likelihood to recommend.
How to calculate it:
NPS = % Promoters (9–10) − % Detractors (0–6)
NPS scores can range from negative to positive values; higher positive scores generally indicate stronger brand loyalty.
When to use it: Quarterly or annual relationship surveys, post-renewal, or when you want to track brand perception over time. NPS is a lagging indicator — it reflects the cumulative experience, not a single moment.
CES (Customer Effort Score)
What it measures: How easy it was for a customer to complete a task or resolve an issue.
How to calculate it:
CES = Average score on a 1–7 or 1–5 "ease" scale
Lower effort correlates strongly with higher loyalty, particularly in support and self-service contexts. ASQ's customer satisfaction resources confirm that short post-interaction surveys like CES work best for transactional checks.
Combining metrics intelligently
The strongest programs use CSAT at the touchpoint level, NPS for relationship tracking, and CES wherever effort is a known friction point (support, checkout, onboarding). Combining them gives you a layered view: CSAT tells you what happened, CES tells you how hard it was, and NPS tells you where the relationship stands.
One caveat: cultural response bias is real. Customers in some markets tend to rate higher or lower regardless of actual experience. If you operate across regions, normalize scores within cohorts rather than comparing raw numbers across markets.
How to set targets that connect to business outcomes
A CSAT target of "80%" means nothing unless it's tied to a business outcome. Here's how to build targets that executives actually care about.
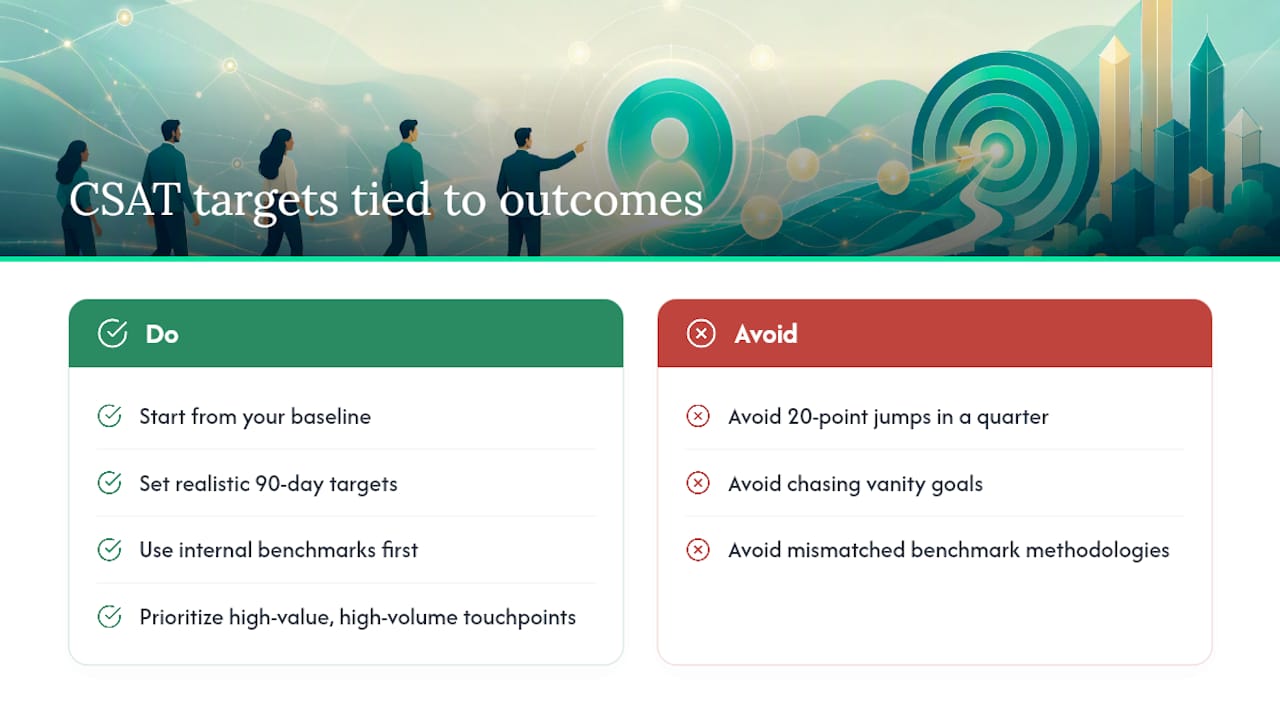
Start with your baseline. If your current CSAT is 72%, a realistic 90-day target might be 76–78%, not 90%. Targets that require a 20-point jump in a quarter are usually vanity goals that demoralize teams when they're missed.
Use internal benchmarks first. Your own historical data is more actionable than industry averages. Track your score by segment, touchpoint, and cohort. A 5-point CSAT improvement in your post-support flow may be worth more than a 10-point improvement in a low-volume touchpoint, according to practical experience.
Translate the target into revenue impact. Here's a simple example: if a 5-point CSAT lift in your post-support flow reduces churn by 2% in that cohort, and that cohort represents $500,000 in annual recurring revenue, the expected retention gain might be $10,000 per year. That's a number a CFO can evaluate. AI-driven revenue analysis tools can automate this translation, turning satisfaction data into projected financial impact.
Use external benchmarks carefully. Industry benchmarks vary by sector, touchpoint, and survey methodology. A B2B software company and a retail brand should not be measured against the same NPS benchmark. When you do use external comparisons, match the methodology as closely as possible — otherwise you're comparing apples to oranges.
What actually drives satisfaction scores
Knowing your score is step one. Knowing why it moved is where the real work happens. The core drivers, roughly in order of impact across most industries:
- Product or service quality: Does it do what you promised? This is the floor. No amount of great service recovers a fundamentally broken product.
- Expectation management: Customers who are surprised by limitations are more dissatisfied than customers who were warned. Setting accurate expectations upfront is one of the highest-leverage moves available.
- Speed and responsiveness: How fast you respond to requests, questions, and problems. Speed is often more important than the quality of the response itself.
- Ease and effort: Friction in any process — checkout, onboarding, support — directly suppresses satisfaction. Reducing effort is often faster to fix than improving quality.
- Resolution quality: When something goes wrong, how well you fix it. A well-handled complaint can produce a more loyal customer than one who never had a problem.
- Price-to-value perception: Customers don't object to paying; they object to feeling like they overpaid. Satisfaction tracks value perception, not price alone.
- Personalization: Customers who feel recognized and understood rate their experiences higher. This doesn't require complex AI — it starts with using a customer's name and referencing their history.
- Employee experience: Frontline staff who are engaged and empowered deliver better interactions. The link between employee satisfaction and customer satisfaction runs in one direction: you can't fake enthusiasm.
Diagnostic methods to find your root cause:
- Thematic analysis of open-text responses: Group verbatim feedback into themes. The themes that appear most frequently in low-score responses are your highest-priority fixes.
- Ticket analytics: Pull your support ticket categories and map them to CSAT scores by issue type. High-volume, low-CSAT ticket types are your clearest signal.
- Journey-level CSAT splits: Compare satisfaction scores across different stages of the customer journey. A drop at a specific stage points directly to the process that needs attention.
A useful hypothesis to test: "Delivery speed is the primary driver of post-purchase CSAT in our e-commerce segment." Run that as a structured test — vary the delivery communication, measure the CSAT delta, and confirm or reject the hypothesis before investing in a fix. Atlassian's guidance on customer feedback makes the same point: structure your feedback so it informs prioritization without replacing judgment.
Practical steps to raise your satisfaction scores
Quick wins first. These are the moves that produce results within 30–60 days:
1. Close the loop at scale. Every detractor (scores between 0 and 6) and every low CSAT score (1 or 2) should receive a personal follow-up within 48 hours where possible. Assign this to a named owner. Track the close-loop rate weekly.
2. Triage your highest-frequency complaint themes. Pull the top three themes from your open-text responses in the last 90 days. Fix the most common one first. Don't try to fix all three simultaneously.
3. Fix the highest-effort touchpoints. Use CES data to identify where customers are working hardest. Reducing friction in those moments produces fast, measurable CSAT gains.

Implementation checklist:
| Action | Owner | SLA |
|---|---|---|
| Assign a close-loop owner for low scores | CX Manager | Week 1 |
| Set 48-hour follow-up SLA for detractors | Support Lead | Week 1 |
| Pull top 3 open-text themes from last 90 days | Analyst | Week 2 |
| Select one theme and define a fix | Product/Ops | Week 3 |
| Re-survey the same cohort after fix | CX Manager | Day 30–60 |
| Report close-loop rate to leadership | CX Manager | Monthly |
Longer-term investments that compound over 3–6 months: staff training on resolution quality, self-service knowledge base expansion, playbooks for common complaint types, and automated customer outreach for proactive communication before problems escalate.
SmartSurvey's listen-understand-prioritize-act-measure sequence reinforces this order of operations: you can't prioritize what you haven't understood, and you can't measure improvement without re-surveying the same cohort.
Sample survey questions and templates you can use today
These templates are ready to deploy. Adapt the wording to your brand voice, but keep the core question structure intact — changing the scale or phrasing mid-program makes trend data unreliable.
Transactional CSAT (1–3 question model)
- "How satisfied were you with your experience today?" (1–5 scale: Very Dissatisfied to Very Satisfied)
- "Did we resolve your issue completely?" (Yes / No / Partially)
- "What's one thing we could have done better?" (Open text)
Relationship NPS
- "On a scale of 0–10, how likely are you to recommend [Company] to a colleague or friend?"
- For Promoters (9–10): "What's the main reason for your score? What do we do best?"
- For Passives (7–8): "What would it take to make your experience a 10?"
- For Detractors (0–6): "We're sorry to hear that. What went wrong, and how can we make it right?"
CES (task-based)
- "How easy was it to [complete your purchase / resolve your issue / get started]?" (1–7 scale: Very Difficult to Very Easy)
- "What made it difficult?" (Open text, shown only to scores 1–4)
Routing low scores
Any response below a threshold (CSAT 1–2, NPS 0–6, CES 1–3) should trigger an automatic alert to the assigned close-loop owner. Don't wait for a weekly report — route it in real time. This is where AI tools for client analysis pay for themselves: automated routing and scoring mean no low score falls through the cracks.
Customer satisfaction as a strategic resource: what the research says
The most important reframe in this guide: satisfaction is not a survey KPI. It's an organizational resource that, when managed systematically, correlates with firm-level financial and market outcomes.
Springer's multi-level construct research demonstrates this explicitly — satisfaction measured at the micro level aggregates into meso and macro outcomes that show up in accounting results and market valuations. That means your CSAT program isn't just a customer service metric; it's a leading indicator of financial performance.
The SIGNAL framework (Scope, Inputs, Gather, Notify, Act, Learn) operationalizes this by treating feedback as a managed asset with named owners at every stage. Perspective AI's operating model measures program health with three lead indicators:
- Response rate: Are enough customers responding to give you a statistically meaningful signal?
- Time-to-insight: How quickly does raw feedback become a prioritized action item?
- Close-loop rate: What percentage of low scores receive a follow-up response?
Executive implications: Report these three metrics alongside your CSAT and NPS scores. A rising NPS with a falling close-loop rate is a warning sign — you're measuring well but not acting. A falling NPS with a rising close-loop rate is a recovery signal — the actions are working, and the score will follow.
AI is changing the measurement game. BCG's analysis of CX in the age of AI finds that as AI agents handle routine procurement and support interactions, the strategic stakes for human-led experience rise. Customers will expect AI to handle the transactional; they'll judge your brand on the expert, trust-building moments that AI can't replicate. That means your satisfaction measurement program needs to capture both automated and human touchpoints — and weight them differently.
For businesses tracking at-risk customers, satisfaction scores are one of the earliest signals of impending churn. A customer whose CSAT drops two consecutive periods is far more likely to leave than one whose score is stable, even if both are technically "satisfied."
Which tools should you use for measurement and analysis?
The right tooling depends on your scale, your existing tech stack, and how much you're willing to invest in analysis versus action. Here are the categories to evaluate:
In-app micro-surveys: Best for SaaS and digital products. Triggered by specific user actions (feature use, session end, milestone completion). High response rates because the survey appears in context.
Support-ticket analytics: Automatically tag and score support interactions. Useful for identifying high-frequency complaint themes without manual review. Look for tools that integrate with your helpdesk and surface CSAT trends by ticket category.
VoC (Voice of Customer) platforms: Full-featured platforms that combine survey distribution, response management, and reporting. Best for mid-market and enterprise teams that need multi-channel measurement and role-based dashboards.
Text analytics and NLP: Turns open-text responses into quantified themes. Essential once your response volume exceeds what a human can read manually. Look for tools that can tag sentiment, topic, and urgency simultaneously.
CX dashboards: Aggregate CSAT, NPS, CES, and operational metrics (response time, resolution rate) into a single view. The best ones connect satisfaction scores to revenue data so you can see the financial impact of a score change.
Closed-loop automation: Routes low scores to the right owner, triggers follow-up messages, and tracks resolution status. This is the category most teams underinvest in — and it's where the most satisfaction improvement happens.
Selection checklist:
- Does it integrate with your CRM and helpdesk?
- Can it route low scores automatically to a named owner?
- Does it support text analytics or NLP for open-text responses?
- Can you set SLA alerts for unresolved low scores?
- Is the pricing model sustainable at your current response volume?
HBR's omnichannel research on 46,000 shoppers confirms that customers who interact across multiple channels behave differently and produce different satisfaction signals. Your tooling needs to capture those signals consistently across every channel, not just the one where you happen to be running surveys.
What most guides get wrong about satisfaction programs
Most satisfaction guides treat the survey as the product. It isn't. The survey is the input. The product is the action you take with what you learn.
The programs that actually move scores share one trait: they have a named human being responsible for closing every low-score loop. Not a team. Not a process. A person. When accountability is diffuse, loops stay open, customers feel ignored, and scores drift downward regardless of how well-designed the survey is.
There's also a tendency to over-index on NPS at the expense of operational metrics. NPS is a useful relationship barometer, but it's a lagging indicator — by the time your NPS drops, you've already lost customers you could have saved. The leading indicators are close-loop rate, time-to-insight, and CSAT at high-risk touchpoints. Watch those weekly, and your NPS will take care of itself.
One more thing most guides skip: the difference between a satisfied customer and a committed customer. Satisfaction is transactional. Commitment is relational. You build commitment by consistently exceeding expectations, by recovering well when you fail, and by making customers feel that you know them. That last part — personalization at scale — is where AI-powered revenue intelligence tools are genuinely changing what's possible for SMBs that couldn't previously afford enterprise-grade CX infrastructure.
Ready to Stop the Revenue Leak?
Your satisfaction scores are telling you something. The question is whether your systems are fast enough to act on it before a customer walks.

Signalengine is built for exactly this: revenue intelligence for small businesses that flags who's about to leave, scores customer behavior automatically, and tells you what to do next — without you having to dig through dashboards. It connects satisfaction signals to churn risk, routes alerts to the right owner, and auto-generates the follow-up campaigns that close the loop. Thirty-one AI-powered tools, one dashboard, starting at $49/month.
See a live demo and watch it score your customer base in real time.
Sources
- Customer satisfaction as a multi-level construct (Springer)
- The new rules of customer experience in the age of AI (BCG)
- How to Build a Customer Feedback Strategy in 2026 | Perspective AI
- Customer satisfaction: What it is and why it matters (Zendesk)
- 10 Ways to Improve Customer Experience - Qualtrics
- How to improve customer experience: a practical step-by-step framework - SmartSurvey
- Customer Feedback: A Guide for Product Teams (Atlassian)
FAQ
How do you define customer satisfaction?
Customer satisfaction measures how well a product, service, or experience meets a customer's expectations. When reality matches or exceeds what the customer expected, satisfaction rises; when it falls short, dissatisfaction and churn risk increase.
What are the three main customer satisfaction metrics?
The three core metrics are CSAT (Customer Satisfaction Score), NPS (Net Promoter Score), and CES (Customer Effort Score). CSAT measures satisfaction with a specific interaction, NPS measures overall relationship strength and likelihood to recommend, and CES measures how easy a task or process was to complete.
What are the primary factors that drive customer satisfaction?
The top drivers are product or service quality, expectation management, response speed, ease of effort, resolution quality, price-to-value perception, personalization, and employee experience. Open-text thematic analysis and ticket analytics are the fastest ways to identify which driver is suppressing your scores.
How long does it take to see improvement after acting on feedback?
Organizations that close feedback loops consistently tend to see measurable changes in satisfaction scores within 1–3 months of implementation, according to SmartSurvey's framework. Quick wins like closing low-score loops within 48 hours and fixing the highest-frequency complaint theme can show results in 30–60 days.
How does Signalengine help with customer satisfaction?
Signalengine scores customer behavior automatically, flags customers showing early churn signals, and routes alerts to the right owner so your team can act before a dissatisfied customer leaves. It connects satisfaction signals to revenue intelligence, giving SMBs enterprise-grade visibility starting at $49/month.
Ready to Stop the Revenue Leak?
Signal Engine gives small and local businesses 31 AI-powered tools to score leads by buying intent, predict churn before it happens, auto-generate email and SMS campaigns, and recover missed calls automatically — all in one dashboard starting at $49/month.
Start your free 7-day trial — no credit card required. Setup takes 5 minutes.