

Pipeline is the inventory of every open deal your team is working right now. Forecast is a narrower, probability-weighted prediction of what will actually invoice in a specific period. You get an accurate revenue prediction by filtering that pipeline down to the right time window and weighting what's left by stage probability, not by adding up everything sitting in the CRM. Treat total pipeline value as your forecast and you'll plan against a number that was never real.
TL;DR:
- Most pipeline totals are inflated due to unverified deals, stale opportunities, and optimistic close dates, making them unreliable as forecasts.
- Effective forecasting requires filtering pipeline deals by expected close date and weighting them with historical stage conversion rates to produce realistic revenue predictions.
- Separating pipeline review from forecast meetings helps prevent resource misallocation and improves forecast accuracy by focusing on deal health versus committed revenue.
- Using pipeline analytics, such as stage distribution, velocity, risk scoring, and coverage ratio, enables early identification of potential forecast gaps and conversion issues.
- Automated tools like Signal Engine streamline pipeline hygiene, provide real-time scoring, and help small teams continually improve forecast precision through data-Driven insights.
Table of Contents
- Pipeline vs Forecast: The Core Distinction Sales Leaders Miss
- What a Sales Pipeline Actually Is
- What a Sales Forecast Is For
- How Pipeline Becomes a Forecast: Filtering and Weighting
- Pipeline Analytics That Actually Predict Conversion
- The Mistake That Breaks Trust: Running One Meeting for Both
- Forecasting Methods: Weighted Pipeline, Historical, and Hybrid Approaches
- A 30 to 90 Day Plan to Fix Pipeline Hygiene and Forecast Accuracy
- How Signal Engine Fits the Pipeline and Forecast Playbook
- Why Separating These Disciplines Is What Actually Scales
- Ready to Stop the Revenue Leak?
- Sources
- FAQ
Pipeline vs Forecast: The Core Distinction Sales Leaders Miss
Pipeline is a snapshot. It's every opportunity your reps are actively working, regardless of when it might close or how likely it is to close at all. A $2 million pipeline might contain deals stretching six months out, deals that stalled three weeks ago, and deals a rep entered at the wrong stage just to hit an activity target.
Forecast is different by design. It's a time-bounded, probability-weighted prediction of revenue for a defined period, usually a month or a quarter. It answers one question: what will realistically close and get invoiced by the deadline that matters to finance and leadership?
The two numbers should never match, and if they do, something's wrong. Pipeline is almost always several multiples larger than forecast, because most open opportunities either slip, stall, or die before they close. Confusing the two isn't a minor terminology slip. It's the most common organizational mistake revenue teams make, and it shows up as blown quarters, panicked resource reallocation, and a CFO who stops trusting sales numbers.
The relationship runs one direction only: pipeline feeds forecast, never the reverse. You can't forecast what isn't in the pipeline, but not everything in the pipeline belongs in the forecast. Keep that asymmetry in mind and most of the confusion below resolves itself.
What a Sales Pipeline Actually Is
A pipeline is a working list of every active opportunity a rep or team is pursuing, tracked through defined stages from first contact to closed deal. Each record typically carries a deal amount, a current stage, an expected close date, and a next action. That's the raw material. Nothing about it is a promise of revenue.
Ownership splits two ways. Reps own the day-to-day accuracy: updating stages, logging next steps, moving stale deals forward or closing them out. Sales operations or RevOps owns the structure underneath it: stage definitions, required fields, and enforcement of hygiene rules so the data means the same thing across every rep's pipeline.
A pipeline that isn't scrubbed regularly develops predictable rot:
- Stage inflation — reps push deals to "negotiation" or "proposal sent" to look productive, when no real buyer conversation has happened.
- Stale deals — opportunities that haven't moved in 60 or 90 days but never get closed out, inflating totals with dead weight.
- Optimistic close dates — a deal parked at "end of quarter" for three quarters running, because nobody wants to admit it slipped.
- Single-threaded deals — one contact, no economic buyer engaged, sitting deep in the pipeline as if it were solid.
None of this is a character flaw in reps. It's what happens when pipeline hygiene isn't measured or coached. A pipeline full of inflated stages and stale dates isn't just messy. It's the raw input for your forecast, and garbage in produces a forecast leadership can't trust.
What a Sales Forecast Is For
A forecast predicts what will realistically ship, close, or invoice inside a specific period. It's not a wish list and it's not the pipeline total with a haircut applied. It's a working estimate that finance uses for cash planning, that leadership uses to set expectations with the board, and that sales managers use to know where to apply pressure before the quarter ends.
Most disciplined forecast processes split deals into two buckets rather than one blended number:
- Commit — deals with a confirmed budget, a clear decision path, and a delivery timing the rep is willing to be held accountable for. If it's in commit and it slips, that's a credibility hit.
- Upside — deals that could close in the period but carry real risk: missing stakeholder, unconfirmed budget, or a timeline that depends on the buyer's internal process rather than yours.
That split matters because commit deals require a clear decision path, confirmed budget, and delivery timing before they earn a spot there. Upside deals are real possibilities, not plan-worthy revenue, and leadership should never build a plan around them.
Forecast accuracy itself is measurable. Forecast error, or variance, is the gap between what you committed and what actually closed. Teams that score their forecasts after every period and run a short retrospective on where the variance came from get sharper every quarter. Teams that never check their own accuracy keep making the same estimation mistakes indefinitely, because nobody's tracking whether last quarter's commit number meant anything.

How Pipeline Becomes a Forecast: Filtering and Weighting
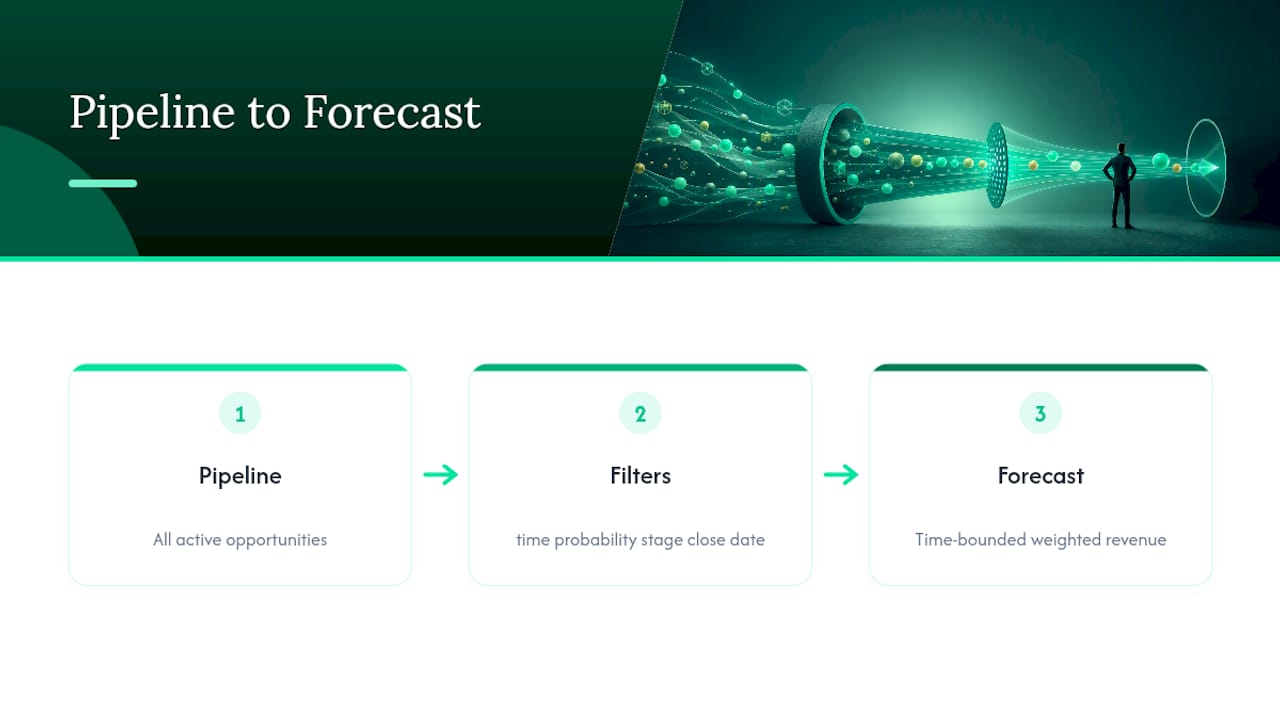
Turning pipeline into forecast is a mechanical process, not a gut call, and it happens in three steps.
- Filter by time. Pull every deal whose expected close date, or better yet expected invoice or dispatch date, falls inside the forecast period. A deal closing in five months has no business in this month's forecast no matter how big it is.
- Weight by stage probability. Apply a probability to each remaining deal based on its current stage, and ground those probabilities in historical conversion rates for that stage and segment, not a generic guess. A stage where deals historically convert 70% of the time gets a 0.7 multiplier; a stage that converts 20% of the time gets 0.2.
- Sum the weighted values. Add up deal amount times stage probability across the filtered set. That total is your weighted pipeline forecast, and it should sit far below your raw pipeline total.
Here's the formula in practice: Forecasted Revenue = Deal Amount × Stage Probability, summed across every deal that survives the time filter.
Take three deals, all expected to close this quarter:
Raw pipeline for these three deals is $160,000. That gap is the entire point. Report $160,000 to your CFO and you've promised revenue that historical conversion rates say won't materialize.
There's a third factor pipeline-only math misses entirely: revenue doesn't only come from deals sitting in the pipeline today. Some of it comes from deals created and closed within the period itself, and some comes from deals pulled forward from a later quarter. A forecast built purely off today's pipeline snapshot undercounts in-quarter creation and mishandles pull-forward, which is one reason purely mechanical weighting still needs a human sanity check layered on top.
Pipeline Analytics That Actually Predict Conversion
Raw pipeline totals lie by aggregation. A $2 million pipeline sounds healthy until you break it apart and find that $1.2 million of it has been sitting in the same stage for two months. Pipeline analytics exist to catch that before it becomes a forecast miss.
Four metrics matter more than the rest:
- Stage distribution — how deal count and dollar value spread across stages. A pipeline heavy at the top and thin at the bottom signals a conversion cliff, not healthy volume.
- Velocity — average days a deal spends in each stage. Rising velocity in a key stage is an early warning that deals are stalling before they ever show up as lost.
- Risk scoring — signals like engagement gaps, single-threaded contacts, or deal age relative to your average sales cycle, flagged automatically rather than caught by memory.
- Coverage ratio — total pipeline value divided by the forecast target for the period. A coverage ratio of several times your forecast target is commonly recommended, though the exact ratio depends heavily on your historical conversion rate by segment.
Pro Tip: Run velocity and risk scoring at the segment level, not just company-wide. A 45-day average stage time can hide a 20-day cycle for inbound deals and a 90-day cycle for outbound enterprise deals sitting in the same blended number.
Velocity deserves particular attention because it doesn't just describe pipeline health. It changes the timing of the forecast itself. A velocity improvement pulls revenue forward into an earlier period, while a velocity slowdown pushes it out, which means your forecast should react to velocity trends before deals actually slip, not after. Segment-level analysis matters here too: aggregated pipeline numbers routinely hide where conversion gaps and replenishment problems actually live, whether that's a specific rep, a specific deal size band, or a specific lead source that's stopped converting. A gap analysis workflow built around these four metrics turns pipeline review from a status update into an actual diagnostic tool.
The Mistake That Breaks Trust: Running One Meeting for Both
The single most common failure is treating the pipeline review and the forecast call as the same conversation. They're not, and running them together produces a predictable consequence: resources get allocated against pipeline totals that were never meant to represent committed revenue, and when the quarter closes short, nobody can explain why because the two disciplines were never separated in the first place.
Run two distinct meetings instead.
- Pipeline review — weekly, rep-by-rep, focused on deal health, coaching, and unblocking stuck opportunities. Participants: reps and their direct manager. Agenda: stage-by-stage walkthrough, risk flags, next actions on stalled deals.
- Forecast call — less frequent, focused on commit, upside, and variance from the prior period's commitment. Participants: sales leadership, RevOps, and often finance. Agenda: commit number, upside number, risks that could move either bucket, and a look back at how accurate last period's commit turned out to be.
Certain red flags should move a deal out of commit immediately, regardless of what the CRM stage says: a slipped close date for the second consecutive period, a deal that's gone single-threaded after the champion left, or a deal expecting a signed purchase order that still hasn't arrived. Any one of those is a signal the forecast number needs adjusting before the period closes, not after.
Pro Tip: If your forecast call spends more time reviewing individual deal stages than discussing commit versus upside, you're running a pipeline review with the wrong audience in the room.
Forecasting Methods: Weighted Pipeline, Historical, and Hybrid Approaches
No single forecasting method fits every sales motion, and picking the wrong one is its own source of error.
- Weighted pipeline forecasting works well when deals are visible, individually trackable, and move through clear stages. It requires clean, historically grounded stage probabilities to mean anything. Skip that grounding and you're weighting deals by guesswork dressed up as math.
- Historical or time-series forecasting looks at past performance trends rather than individual deals, and it works better when pipeline data is thin, unreliable, or when seasonality drives most of the variance. It needs a reasonably stable trend line to be useful; a business in rapid transition will get misled by its own history.
- Hybrid forecasting combines weighted pipeline math with trend adjustments and the commit/upside layering described earlier. Most mature revenue teams end up here, because it catches what pure pipeline weighting misses (seasonality, market shifts) while staying anchored to real, named deals rather than pure extrapolation.
The failure modes across all three methods tend to repeat: dirty stage data that makes weighted probabilities meaningless, probability assumptions borrowed from a generic playbook instead of your own conversion history, and ignoring the gap between when a deal legally closes and when it actually invoices or ships. That last one matters more than most teams realize. A deal that closes on the 28th but doesn't invoice until the following month belongs in next period's forecast, not this one, and plenty of otherwise solid forecasting models get that timing wrong by defaulting to close date alone.
A 30 to 90 Day Plan to Fix Pipeline Hygiene and Forecast Accuracy
You don't need a quarter-long transformation project to fix a broken forecast process. A focused sequence over 30 to 90 days gets most teams to a defensible number.
- Week 0: Define stage-entry criteria. Write down exactly what has to be true for a deal to sit in each stage, then update CRM required fields to enforce it. "Proposal sent" should mean a proposal was actually sent, not that a rep feels optimistic.
- Weeks 1 to 4: Run a full pipeline scrub. Go deal by deal. Close out anything stale, correct stages that don't match the new criteria, and flag single-threaded deals for a second contact push.
- Months 2 to 3: Build your conversion baseline. Record actual stage-to-close conversion rates by segment, set coverage targets based on that data instead of a rule of thumb, and automate the dashboard so this isn't a manual pull every week.
- Ongoing: Weekly pipeline reviews, monthly forecast retrospectives. Track forecast error every period and adjust your stage probabilities as real conversion data accumulates.
Pro Tip: Don't wait for perfect data to start the scrub. A rough pass that removes obviously stale and inflated deals improves your forecast more in week one than another month of waiting for "clean" data ever will.
Small teams pulling this off manually often hit a wall around month two, right when conversion-rate tracking and dashboard automation start eating hours nobody has. That's usually the moment a messy CRM turns into a forecasting bottleneck rather than a solved problem, and it's exactly where automated scoring and dashboarding tools earn their keep instead of being a nice-to-have.
How Signal Engine Fits the Pipeline and Forecast Playbook
Everything in this playbook, from stage-probability grounding to risk scoring to segment-level velocity, requires data that's actually current and actually scored, not a spreadsheet someone updates when they remember. That's the gap Signal Engine is built to close for small and midsize sales teams who don't have a dedicated RevOps analyst on staff.
A few features map directly onto the mechanics covered above:
- Buy-readiness scoring replaces manual stage-inflation guesswork with a signal-based read on which deals are actually moving.
- Churn prediction extends the same probability logic past the close, flagging accounts at risk before renewal, which matters for any team forecasting recurring revenue alongside new bookings.
- Pipeline analytics dashboards surface stage distribution, velocity, and risk flags automatically instead of requiring a weekly manual pull.
- Action drafting turns a risk flag, like a single-threaded deal or a stalled stage, directly into a next step queued for one-click approval.
Signal Engine includes industry-specific modes and customization to ensure stage definitions and scoring logic are tailored rather than generic. For any business that doesn't fit an existing mode, an onboarding AI builds a custom one rather than forcing a one-size-fits-all dashboard.
A practical pilot looks like this: connect your existing CRM data, run an initial pipeline scrub using the buy-readiness scores as a sanity check against your current stages, then turn on churn prediction for your existing customer base while the sales side stabilizes. Most teams see where their pipeline hygiene problems actually live within the first week of that process.
Why Separating These Disciplines Is What Actually Scales
The instinct to fold pipeline and forecast into one number comes from a good place. Leaders want simplicity, and a single blended metric feels efficient. In practice, that instinct is exactly what breaks revenue predictability at scale, because it papers over the difference between what a rep hopes will happen and what the data says will happen.
Organizational clarity beats centralized optimism every time I've seen the two compared. A rep managing their own pipeline hygiene, an ops function enforcing stage discipline, and a leadership team owning the commit number, each doing their distinct job, produces a forecast that survives contact with an actual quarter close. Blend those roles together and you get a number everyone half-believes and nobody fully owns.
If there's one habit worth adopting from this entire framework, it's measuring forecast error every single period and treating that number as seriously as the forecast itself. A forecast nobody checks for accuracy isn't a forecast. It's a guess with better formatting.
— Bernard
Ready to Stop the Revenue Leak?
Signal Engine gives small and local businesses 31 AI-powered tools to score leads by buying intent, predict churn before it happens, auto-generate email and SMS campaigns, and recover missed calls automatically — all in one dashboard starting at $49/month.
Most forecasting tools built for enterprise RevOps teams charge per seat and assume a dedicated analyst is watching the dashboard. Signal Engine skips both of those assumptions. Every plan includes the full feature set, pricing starts at $49 a month on the Growth plan at $149 per month, and setup connects your existing CRM data without a multi-week onboarding cycle.

If you're still scrubbing pipeline data in a spreadsheet and guessing at stage probabilities, the fastest way to see the difference is to connect your own data and watch the buy-readiness scores populate against deals you already know well. Explore the full feature set for small businesses or start your free 7-day trial, no credit card required, with setup that takes about 5 minutes.
Sources
- Pipeline vs Forecast: Understanding the Critical Distinction for Revenue Operations - 2026 Guide
- Pipeline Analytics: How to See What's Really Happening in Your Funnel | SyncGTM
- Pipeline Forecasting: A Practical Guide for B2B Sales and RevOps Teams
- Forecast vs Pipeline: The Difference (B2B Examples)
FAQ
What does pipeline mean in business terms?
In sales, pipeline refers to the complete inventory of active opportunities a rep or team is currently working, tracked by stage, deal amount, and expected close date. It's a snapshot of activity, not a prediction of what will actually close, since it includes deals with a wide range of real probabilities mixed together.
What is a pipeline forecast?
A pipeline forecast is the revenue prediction you get by filtering pipeline deals to a specific time period and weighting each one by its stage probability, based on historical conversion rates rather than raw totals. It's typically far smaller than the total pipeline value because most open deals in early stages won't convert within the period.
What are the four types of forecasting?
Sales teams generally rely on weighted pipeline forecasting, historical or time-series forecasting, length-of-cycle forecasting, and hybrid models that blend weighted pipeline data with trend adjustments. The right choice depends on how reliable your stage-level conversion history is and how much your business is affected by seasonality.
What are the five stages of a sales pipeline?
Most pipelines follow a version of prospecting, qualification, proposal, negotiation, and closed-won or closed-lost, though exact stage names vary by company and industry. What matters more than the labels is having clear, enforced entry criteria for each stage so a deal's position in the pipeline actually reflects reality.
Does Signal Engine help with pipeline hygiene and forecasting?
Yes. Signal Engine's buy-readiness scoring and pipeline analytics dashboard are built to flag stalled or inflated deals automatically, which directly supports the stage-discipline and hygiene practices needed for an accurate forecast. Current pricing and plan details are available on the Signal Engine pricing page.