

Sales pipeline analytics turns raw deal data into a forecast you can trust, a leak detector that flags where revenue disappears, and a prioritization tool that tells reps and managers what to work on next. The discipline runs on four metric categories: volume (how many deals), quality (how good are they), velocity (how fast they move), and value (what they're worth). Get those four right and everything else in this guide follows.
TL;DR:
- Dropping pipeline volume signals potential revenue issues two to three months in advance, requiring immediate prospecting efforts before lagging metrics decline.
- Tracking lead qualification rate and deal source segment performance helps predict future win rate problems and isolate weaknesses early.
- Segmenting pipeline data by rep, product, and deal size reveals specific bottlenecks or underperforming stages that need targeted fixes.
- Regularly updating dashboards daily for reps and weekly or monthly for executives ensures timely detection of leaks and accurate forecasting adjustments.
- Ensuring data quality by fixing stale close dates and standardizing stage definitions prevents distorted metrics that compromise analysis accuracy.
Table of Contents
- Core Sales Pipeline Analytics Metrics to Track
- How Do You Conduct a Sales Pipeline Analysis?
- What Belongs on Executive, Manager, and Rep Dashboards?
- Segmenting Pipeline Data and Choosing the Right Benchmarks
- Tools and Templates to Run Pipeline Analytics
- Data Quality Pitfalls That Wreck Pipeline Analytics
- The 30/60/90-Day Pipeline Analytics Action Plan
- Integrating Pipeline Analytics With Sales Forecasting Models
- Best Practices for Continuous Pipeline Improvement
- How External Factors Distort Pipeline Performance Metrics
- Signal Engine's Perspective: Solving Pipeline Problems for SMBs
- Ready to Stop the Revenue Leak.
- Sources
- FAQ
Core Sales Pipeline Analytics Metrics to Track
Most sales teams track too many numbers and act on too few. The fix is organizing everything under four buckets, an approach reworked pipeline metric guidance backs directly, and knowing which ones are early warnings versus after-the-fact report cards.
Volume measures deal count and total pipeline dollars by stage. Track new pipeline created weekly and total open opportunities. This is a leading indicator: a volume drop today shows up in closed revenue two or three months from now.
Quality measures how likely deals are to close. Lead score, opportunity qualification rate, and percentage of deals with a confirmed budget and timeline all belong here. Quality is also leading; a slide in qualification rate predicts a future win-rate problem before it hits the scoreboard.
Velocity covers speed. Average sales cycle length, stage conversion rates, and pipeline velocity itself (pipeline value multiplied by win rate, divided by cycle length in days) tell you how fast money moves through the funnel. Velocity mixes leading and lagging signals depending on which stage you isolate.
Value is the lagging category: average deal size, win rate, and total closed revenue. These confirm what already happened.
Pro Tip: If new pipeline volume drops for a sustained period, don't wait for the forecast miss to show up. Trigger prospecting activity immediately, before the lagging value metrics catch up to the story.
- Volume: new pipeline created, open deal count, pipeline coverage ratio
- Quality: lead score distribution, qualification rate, budget confirmed %
- Velocity: average cycle length, stage conversion rate, pipeline velocity
- Value: average deal size, win rate, closed won revenue
How Do You Conduct a Sales Pipeline Analysis?
A pipeline analysis works best as a repeatable five-step process, not a one-off audit you run when the CEO asks for numbers.
- Define the pipeline. Lock stage definitions and exit criteria so "qualified" means the same thing to every rep.
- Assign ownership. One person, usually a RevOps lead or sales manager, owns data extraction and metric calculation each cycle.
- Extract snapshot and cohort data. Pull point-in-time pipeline snapshots weekly, plus historical cohorts (deals grouped by create month) so you can track how a group ages over time, not just where it sits today.
- Segment before calculating. Split by rep, product line, deal source, and ARR band before running the math. A blended average hides which segment is actually broken.
- Diagnose the leaks. Compare stage-to-stage conversion rates and time-in-stage against your own historical baseline to find where deals stall or die.
Pro Tip: When a stage conversion rate drops, check time-in-stage first. Deals that sit too long usually die of neglect, not disqualification.
For teams struggling with inconsistent CRM records before this even starts, a dedicated forecasting workflow walks through cleaning that data first.
What Belongs on Executive, Manager, and Rep Dashboards?
A dashboard built for one audience confuses every other audience. Zendesk's pipeline metrics guidance recommends three distinct views, each with its own cadence and owner.
- Executive view: weighted pipeline trend, forecast versus quota, pipeline coverage ratio. Reviewed monthly by RevOps or sales leadership.
- Manager view: stage conversion heatmap by rep, pipeline waterfall (showing what moved in, out, up, or down since the last snapshot), and win rate by segment. Reviewed weekly.
- Rep view: individual deal aging, next-step status, and personal quota attainment. Reviewed daily.
The pipeline waterfall deserves special attention. It's the fastest way to answer "why did the forecast change" in a Monday pipeline review, because it separates new pipeline, closed deals, and slipped deals into distinct visual buckets instead of one blended number.
Update cadence matters as much as content. Rep-level data should refresh daily since reps act on it constantly; executive dashboards can run weekly or monthly without losing value.
Segmenting Pipeline Data and Choosing the Right Benchmarks
Averages lie. A 22% win rate across the whole team might hide a 40% win rate on enterprise deals and a 9% win rate on self-serve leads. Segment before you benchmark anything.
Useful segmentation axes include:
- Rep or team, to isolate coaching opportunities
- Product line, since cycle length and deal size vary by offering
- ARR or deal size band, because a $5,000 deal and a $50,000 deal don't move through the funnel the same way
- Lead source, to see which channels actually convert versus just generate volume
Before comparing anything to an external benchmark, fix close-date hygiene and cohort alignment. A deal with a stale close date pushed back three times will wreck your cycle-length math regardless of what benchmark you're measuring against. Internal cohort comparisons should come first, since they control for your product and process; external industry figures only add context once your own baseline is trustworthy.
Tools and Templates to Run Pipeline Analytics
You don't need custom-built software to start. Salesforce publishes a pipeline analytics template that turns pipeline snapshot data into a ready-made waterfall dashboard, and a spreadsheet with weekly snapshot exports works as a fallback for smaller teams.
Build these three artifacts first, regardless of tool:
- A pipeline waterfall showing stage-to-stage movement week over week
- A cohort conversion table tracking deals by create month through to close
- A time-in-stage table flagging deals that have sat too long
Teams with more mature CRM data can layer in journey or Sankey-style visualizations, which expose non-linear buyer paths that a standard funnel report hides entirely. For small teams without a dedicated RevOps analyst, a platform like Signal Engine automates the scoring and leak detection this section describes, without requiring a spreadsheet rebuild every week.
Data Quality Pitfalls That Wreck Pipeline Analytics
Bad data produces confident, wrong answers. Arbitrary stage probabilities and skipped segmentation are the two most common culprits behind a forecast that misses badly despite looking solid on paper.
- Stale close dates push cycle-length calculations off track; fix by auditing any deal untouched for 30+ days.
- Guessed stage probabilities (a flat 50% for every "mid-funnel" deal) flatten your weighted forecast; replace with probabilities derived from actual historical conversion rates.
- Duplicate or orphaned records inflate volume metrics; run a monthly dedupe pass.
- Inconsistent stage definitions across reps distort conversion rates; standardize exit criteria in writing.
Run this four-item check every month, not once a quarter, and most forecast surprises disappear before they reach the board deck.
The 30/60/90-Day Pipeline Analytics Action Plan
Analysis without a deadline turns into a slide deck nobody acts on.
- Days 1 to 30: Standardize stage definitions, assign a data owner, and build the baseline waterfall and cohort tables. KPI: 100% of open deals tagged with a valid stage and close date.
- Days 31 to 60: Segment by rep and source, identify the single worst-converting stage, and fix its root cause, whether that's lead quality, messaging, or rep coaching. KPI: stage conversion rate improvement in the flagged segment.
- Days 61 to 90: Automate weekly snapshot capture and dashboard refresh. KPI: weighted pipeline growth attributable to the fixed segment, measured against the pre-fix baseline.
Pro Tip: Pick one leaking segment, not five. Teams that try to fix every stage at once usually fix none of them by day 90.
A gap analysis workflow and strategies for pipeline optimization both offer additional structure for teams building this out for the first time.
Integrating Pipeline Analytics With Sales Forecasting Models
Pipeline analytics and forecasting aren't separate exercises. A weighted forecast is just pipeline value multiplied by a probability derived from your own historical conversion data, segmented the same way your analysis already is.
The connection breaks when teams forecast off gut feel instead of stage-specific historical win rates.
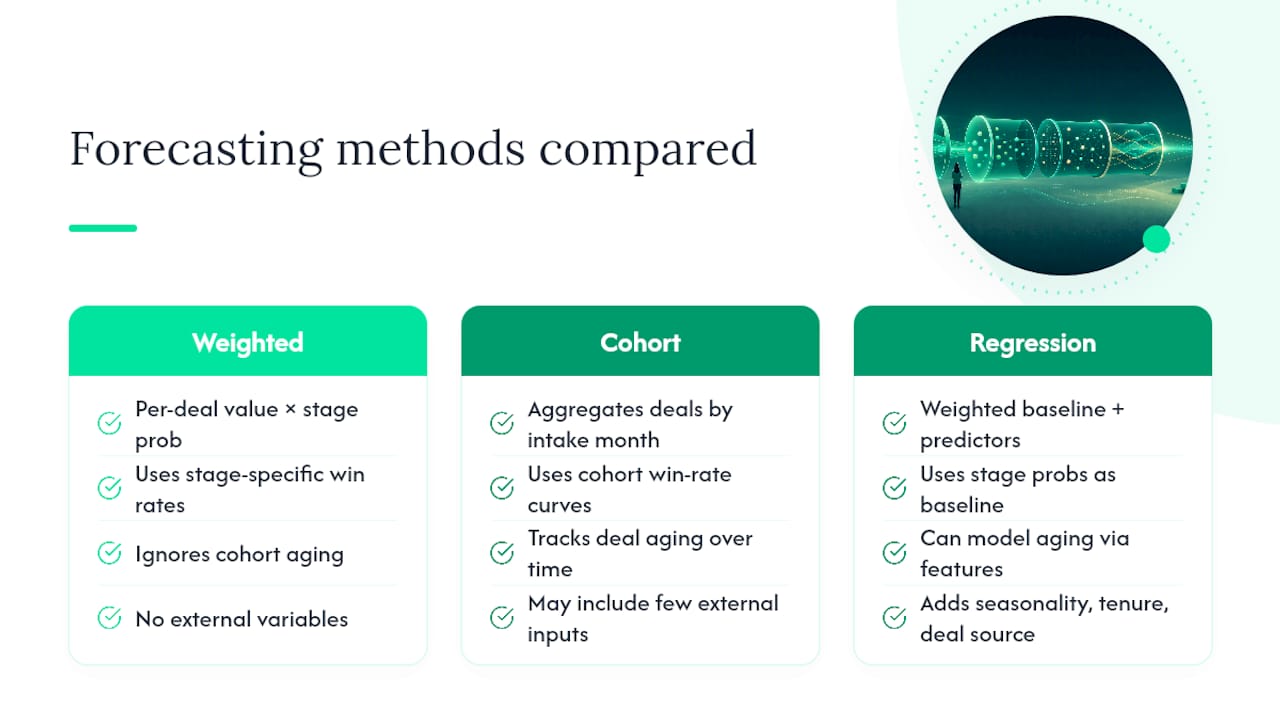
Three forecasting techniques pull directly from pipeline analytics data. Weighted pipeline forecasting multiplies each deal's value by its stage-specific historical close probability. Cohort-based forecasting tracks how a monthly intake of deals ages and closes over time, useful for spotting whether this quarter's new pipeline is converting faster or slower than last quarter's. Regression-based forecasting layers in external variables (seasonality, rep tenure, deal source) once the baseline weighted model is stable.
The mistake most teams make is bolting a forecasting model onto dirty data. If stage probabilities are guessed rather than calculated, and close dates are stale, no forecasting technique fixes that underneath. Forecast accuracy is a downstream effect of pipeline data quality, not a separate discipline you can improve in isolation. Fix the inputs described in the data quality checklist first, then let the forecast model inherit that accuracy.
Revisit your probability-to-stage mapping every quarter. Win rates drift as your market, product, and rep team change, and a probability model built two years ago on old data will quietly mislead every forecast built on top of it.
Best Practices for Continuous Pipeline Improvement
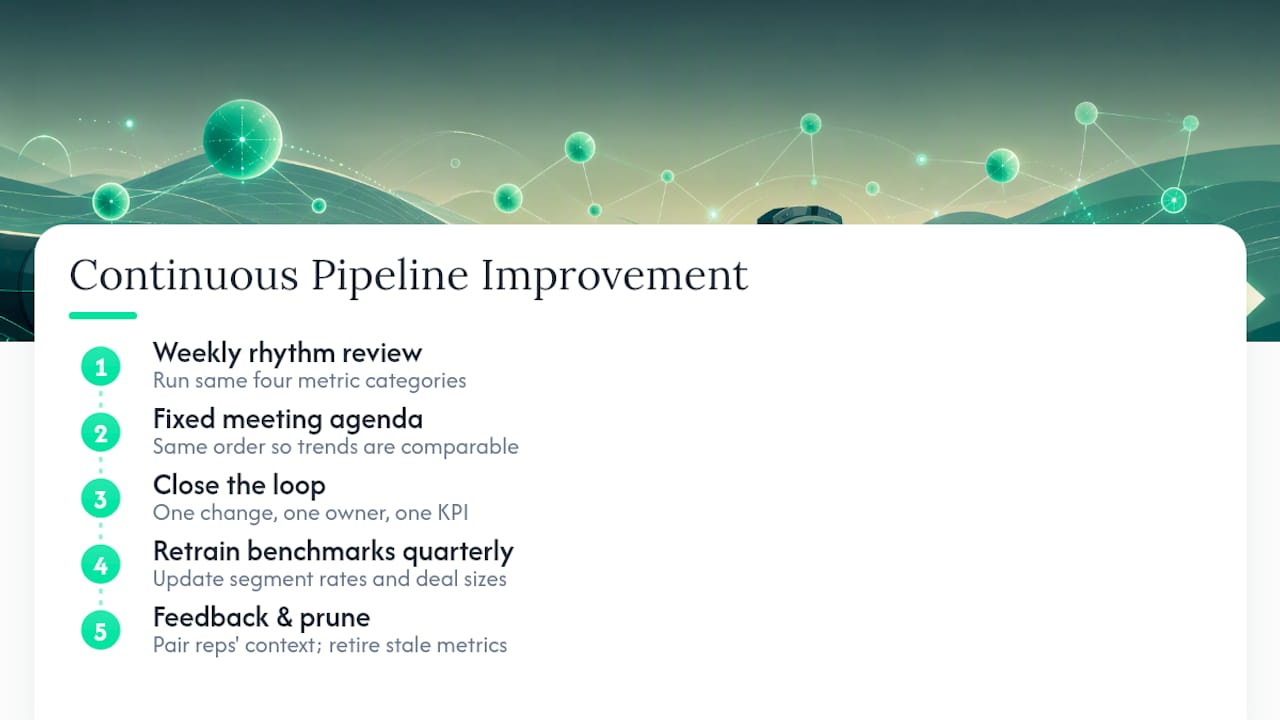
Pipeline analytics loses value fast if it's a quarterly event instead of a habit. The teams that improve consistently treat it as a weekly rhythm with a fixed agenda, not an ad hoc deep dive triggered by a bad month.
Run the same four metric categories every week, in the same order, so trend lines are comparable. A one-off analysis that changes its own methodology month to month can't tell you if things are actually getting better.
Close the loop between diagnosis and action. Every pipeline review should end with one specific change, owned by one specific person, measured against one specific KPI. A meeting that surfaces a problem but assigns no owner is a wasted hour.
Retrain your benchmarks quarterly. Segment-level conversion rates and average deal sizes shift as your team grows, your product evolves, and your ideal customer profile matures. A benchmark from 18 months ago measures a company that no longer exists.
Build a feedback loop between reps and the data. Reps see deal-level context (a champion left the company, budget got frozen) that raw pipeline numbers can't capture. Pairing that qualitative context with the quantitative metrics catches problems the dashboard alone will miss.
Finally, resist the urge to add new metrics faster than you retire old ones. A dashboard that grows every quarter without ever removing a stale metric eventually gets ignored entirely. Fewer metrics, tracked consistently and acted on every week, beat a sprawling scorecard nobody reviews.
How External Factors Distort Pipeline Performance Metrics
Not every pipeline swing is a sales execution problem. Seasonality shifts buying cycles predictably: budget cycles compress deals into Q4 in many B2B categories, and vacation-heavy months slow every velocity metric regardless of rep performance.
Macroeconomic conditions move deal size and cycle length in ways no coaching plan can fix. A tightening budget environment stretches approval chains, which shows up in your data as a velocity problem when the actual cause is procurement policy at your buyers' companies.
Competitive activity moves quality metrics. A new entrant undercutting on price will quietly drop your win rate in a specific segment before anyone notices the pattern, which is why segmenting by source and competitor context matters as much as segmenting by rep.
Internal changes count as external to the metrics themselves: a new CRM rollout, a comp plan change, or a reorg all introduce noise that looks like a performance problem but is actually a process disruption. Before diagnosing a metric drop as a coaching issue, check the calendar for anything that changed operationally in that window.
The practical takeaway is to annotate your dashboards with context, not just numbers. A velocity dip that coincides with a known seasonal slowdown or a comp plan change needs a different response than the same dip with no external explanation attached.
Signal Engine's Perspective: Solving Pipeline Problems for SMBs
Most SMB teams don't lack pipeline data. They lack the hours to score it, segment it, and flag leaks weekly. Signal Engine automates that cadence across 12 verticals, turning a quarterly scramble into a standing weekly signal.
— Bernard
Ready to Stop the Revenue Leak.
Signal Engine gives small and local businesses 31 AI-powered tools to score leads by buying intent, predict churn before it happens, auto-generate email and SMS campaigns, and recover missed calls automatically — all in one dashboard starting at $49/month. If you've made it through the playbook above and are wondering who's going to run it every week, that's exactly the gap Signal Engine was built to close for teams without a dedicated RevOps hire.

Explore the full feature set for small business revenue intelligence or check pricing and the free trial tier to see where your team fits. Setup takes about five minutes, and you can start your free 7-day trial with no credit card required].
Sources
For hands-on implementation, start with the Salesforce pipeline analytics template for a ready-made waterfall dashboard, and the pipeline metrics KPI overview for full definitions of the volume, quality, velocity, and value categories referenced throughout this guide.
- Pipeline Analytics Template
- Pipeline Metrics: 12 Essential KPIs to Track
- 15 Sales Pipeline Metrics to Track for Better Quality Deals
- 11 important sales pipeline metrics to track in 2026
FAQ
What Is Sales Pipeline Analytics?
Sales pipeline analytics is the practice of measuring deal volume, quality, velocity, and value across your pipeline to forecast revenue, spot leaks, and prioritize which deals or segments need attention.
What Are the Most Important Pipeline Metrics?
Average sales cycle, win rate, average deal size, stage conversion rate, and pipeline velocity rank among the most commonly tracked metrics across sales teams.
How Often Should I Review Pipeline Analytics?
Reps should review deal-level data daily, managers should review stage conversion and waterfall views weekly, and executives typically review weighted pipeline trends monthly.
What's the Difference Between a Leading and Lagging Pipeline Indicator?
Leading indicators, like new pipeline volume and qualification rate, predict future results and give you time to act; lagging indicators, like win rate and closed revenue, confirm what already happened.
Can Small Teams Run Pipeline Analytics Without a Dedicated Analyst?
Yes. A spreadsheet built on weekly snapshots or a CRM template can get a small team started, and platforms like Signal Engine automate the scoring and leak detection so teams without a RevOps hire can keep the cadence weekly.