

A quarterly business review (QBR) is the highest-leverage meeting on your calendar. It's the one forum where your entire leadership team examines whether the business is on the trajectory you planned, diagnoses why it isn't, and commits to the adjustments that will shape the next 90 days. Done right, it's not a reporting ceremony. It's a decision engine.
What quarterly business reviews actually do for your strategy
The role of quarterly business reviews is to serve as the nerve center of your business, not a slide deck marathon. A QBR is a structured meeting held every three months to diagnose past performance and commit to specific future actions. The emphasis is on commit. Status updates report what happened. QBRs interrogate why it happened and force decisions about what changes next.
Here's what a well-run QBR accomplishes:
- Evaluates progress against quarterly and annual goals with honest, unfiltered data
- Diagnoses root causes behind underperformance rather than accepting surface-level explanations
- Aligns cross-functional teams so Sales, Marketing, Product, and Finance all see the same business reality simultaneously
- Commits to forward actions with named owners, deadlines, and measurable outcomes
- Surfaces dependencies between departments that are invisible in weekly standups or monthly departmental reviews
- Drives accountability by creating a visible checkpoint where assumptions meet execution reality
The quarterly cadence sits in a productive middle ground. Monthly reviews often lack enough data to identify meaningful trends. Semi-annual reviews wait too long to course-correct. The quarter is the shortest period in which strategic bets produce measurable results, making it the right unit of time for honest evaluation and agile adjustment.
Why the importance of business reviews compounds over time

QBRs don't just keep you informed. They keep you from drifting. After annual goal-setting, teams put their heads down and execute. New projects pop up. Priorities shift. Without a structured 90-day checkpoint, even the best teams can drift far from their original targets before anyone notices.
The benefits of quarterly reviews stack up across four dimensions:
- Accountability: When quota attainment numbers are on the screen and leadership is in the room, there's no hiding behind optimistic projections. The numbers either support the strategy or they don't.
- Course correction: A territory that underperformed in Q1 doesn't have to underperform in Q2, but only if someone identifies the root cause and acts on it before another quarter slips by.
- Transparency: QBRs create space for cross-functional teams to share their perspective on shared data, not just their own slice of it.
- Performance-to-plan visibility: The only way to know if your go-to-market strategy is working is to measure it consistently against the plan you set.
ClearPoint Strategy data shows that only 39.85% of goals are green at any given time across their platform's strategic plans. That means most QBRs should spend the majority of time on the goals that are yellow or red, not celebrating the ones already on track. A QBR that fails to produce clear decisions about what to change leaves the organization defaulting to whatever it was already doing. Three months of inertia, compounded four times a year, is how strategies stall while everyone stays busy.
Pro Tip: Set a rule before every QBR: if a topic can be resolved by a single team without leadership input, it doesn't belong on the agenda. Reserve QBR airtime for decisions that require cross-functional alignment, resource trade-offs, or strategic direction changes.

Key elements that make a QBR actually work
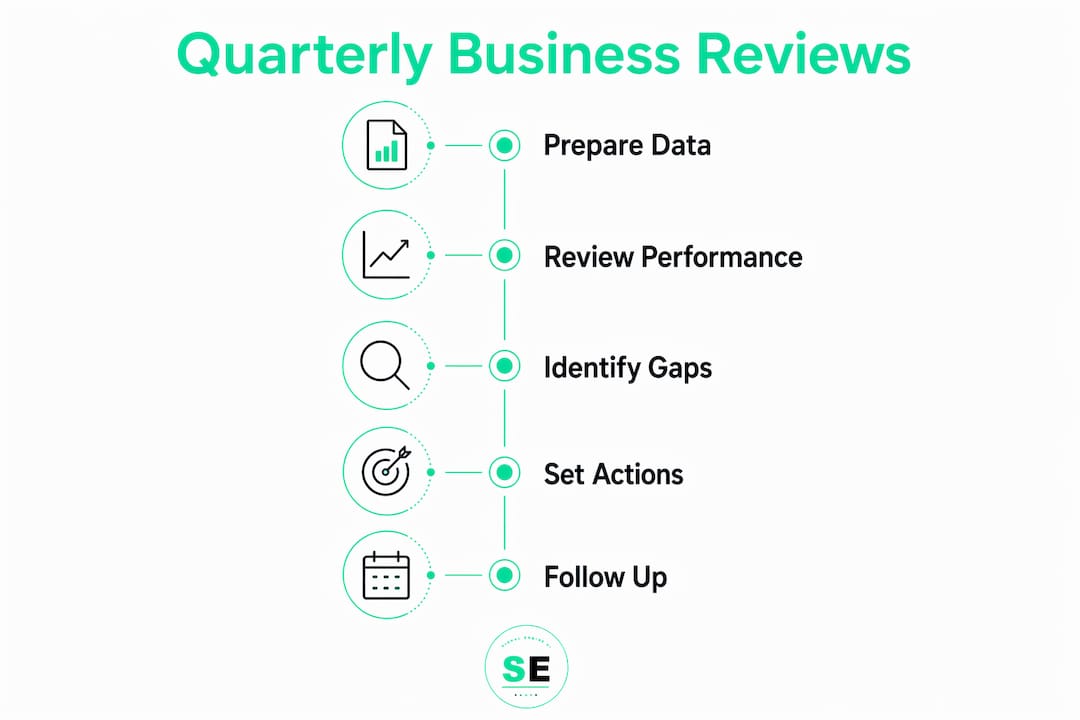
Structure separates a productive QBR from an expensive status update. The most effective quarterly reviews share three defining characteristics.
Concise pre-reads, distributed in advance. Disciplined teams prepare a 5–8 page pre-read sent 48 hours before the meeting. This document compresses raw data into strategic narrative, answering the question executives actually need answered: "What changed, and what does it mean?" When attendees arrive already informed, the meeting itself can focus entirely on decisions.
A phased agenda with deliberate time allocation. Effective QBRs separate into two distinct segments:
- Look-back phase: Review past performance, identify what fell short, and diagnose root causes without defensive spin
- Look-forward phase: Plan forward actions, set S.M.A.R.T. goals for the next quarter, and allocate resources based on what the diagnosis revealed
A decision log updated in real time. Every decision made during the QBR gets recorded with a named owner, a deadline, and documented next steps. Without this, commitments evaporate within 48 hours. The decision log is the single most important output of the meeting, because it's what transforms insight into change.
Additional elements that belong in every QBR:
- Exception reporting focused on what demands attention, not a full scorecard walkthrough
- Initiative portfolio review covering what's in flight and what could derail it
- Risk escalation for issues that need executive-level input
- Resource reallocation decisions based on new priorities
Best practices to conduct QBRs that actually drive decisions
The mechanics of a great QBR matter less than the discipline behind them. Here's what separates teams that get real value from their quarterly reviews from those that just go through the motions.
Distribute the pre-read 48 hours early. This isn't optional. When attendees read the data beforehand, the meeting shifts from "let me explain this chart" to "here's what we're going to do about it." That shift is worth more than any agenda tweak.
Invite decision-makers, not audiences. For a C-suite QBR, typically a handful of senior leaders attend, such as CEO, CFO, and VPs of major functions. For a departmental QBR, a smaller group of key leaders participates. Don't invite people just to give them context. That's what the pre-read is for.
Time-box ruthlessly. A well-run QBR fits within about an hour, with time divided appropriately among key segments like scorecard review, initiative updates, and decision-making. Overruns don't happen when the facilitator is disciplined.
Lead with the story, not the data. Industry experts including Dale Carnegie emphasize that a QBR is a chance to tell the story of the past 90 days, not just present the numbers. Before the meeting, align with key stakeholders on the narrative behind the data. What explains the gap? What context fills in what the numbers can't show?
Connect the QBR to the next quarter's plan. Separating diagnosis from planning leads to repeated performance issues. The QBR is the diagnostic phase. Planning is the prescriptive phase. Treat them as one continuous process, not two separate events.
Follow up with monthly pulse checks. Don't wait 90 days to find out whether the adjusted plan is working. Set monthly checkpoints on the specific metrics the QBR flagged as critical. These aren't full QBRs. They're focused check-ins on the three or four branches that leadership identified as urgent.
Pro Tip: Integrate QBR outcomes directly into your quarterly planning cycle. The metric tree you used to diagnose underperformance in the review becomes the basis for target-setting and initiative prioritization in planning. When these two phases connect, the quarterly rhythm compounds.
Common mistakes that kill QBR effectiveness
Most QBRs fail in predictable ways. Recognizing these patterns is the first step to breaking them.
- Turning QBRs into reporting ceremonies. Department-by-department slide presentations, dense with charts nobody interrogates, ending with vague commitments nobody tracks. This format feels productive but produces nothing.
- Covering everything. When the agenda includes every departmental metric, every initiative update, and every operational detail, the meeting becomes a marathon that exhausts participants without producing decisions.
- Vague action items. "Let's revisit our approach to enterprise" is an observation, not a decision. Every commitment needs an owner, a deadline, and a specific outcome.
- Defensive presentations. When presenters know they'll be judged on their numbers, they cherry-pick favorable time ranges, bury bad metrics in appendices, and prepare spin for anything off track. The leadership team never sees the real picture.
- Excluding cross-functional perspectives. A QBR where only one function presents misses the interdependencies that only surface when everyone examines the full business together.
- Skipping the revenue dashboard prep. Walking into a QBR without clean, connected data forces the meeting into data archaeology instead of decision-making.
- No follow-through system. ClearPoint data shows that 81% of assigned owners never update their metrics without visible accountability. The decision log and monthly check-ins are what close that gap.
What a strong QBR presentation actually looks like
The structure of your presentation sets the tone for the entire meeting. Get this right and the conversation flows naturally toward decisions.
Start with wins. Open with the quarter's genuine successes. This isn't cheerleading. It establishes a positive foundation and gives each team a moment to showcase their contributions to the broader group. It also makes the harder conversations that follow easier to have.
Move into candid opportunities. This is not the time to sugarcoat major issues, and it's not the time to start a blame game. Frame shortcomings in terms of the obstacles that prevented growth rather than a series of declining charts. Use the data story you developed in your pre-meeting stakeholder alignment to explain how things got off track.
Show performance against annual goals. Are you on track? Off track? Be transparent. This is where the QBR earns its credibility as a forum for honest conversation rather than a performance review.
Present forward-looking plans with S.M.A.R.T. goals. Specific, Measurable, Achievable, Relevant, and Time-bound goals give the next quarter a clear target. Include resource needs and identified blockers so leadership can make real allocation decisions in the room.
Use visuals that serve the narrative. Charts and graphs should illustrate the story, not replace it. If a visual requires more than 10 seconds to interpret, it's doing the opposite of what you need.
Pro Tip: End the presentation with something concrete and forward-looking that everyone takes with them. A customer success story, a specific win tied to a strategic initiative, or a clear statement of the single most important priority for the next 90 days. The tone you set at the close of the meeting becomes the energy for the quarter ahead.
How QBRs function as your cross-functional alignment engine
No other meeting does what a QBR does for organizational alignment. Weekly standups catch operational problems. Monthly reviews surface trends. But neither operates at the altitude required to evaluate whether the business strategy is actually working.
The QBR is the one forum where Marketing, Product, Finance, and Sales see the same business reality simultaneously. Marketing learns what happened to the leads they generated. Product learns whether the features they shipped moved the metrics they targeted. Finance sees whether revenue composition matches the forecast assumptions. Sales learns whether pipeline quality is changing. These cross-departmental connections are invisible in every other meeting format.
This alignment function matters for several concrete reasons:
- Shared KPIs replace siloed metrics. When every function looks at the same top-level outcome and its drivers, misalignment surfaces quickly and gets addressed before it compounds.
- Resource allocation becomes rational. Cross-functional visibility reveals where investment is producing results and where it isn't, enabling leadership to reallocate with confidence rather than politics.
- Risk mitigation improves. Dependencies between teams that would otherwise stay hidden get surfaced and resolved in the QBR, before they become execution failures.
- Accountability becomes collective. When Sales, Marketing, and Product all see the same pipeline health data, finger-pointing gives way to shared problem-solving.
McKinsey research identifies QBR ownership, dependency alignment, and KPI-OKR integration as the critical factors that determine whether a QBR creates genuine vertical and horizontal alignment or just the appearance of it. Once these elements are in place, the QBR acts as the nerve center of the organization, transmitting key strategic signals across every function.
How to prepare for a QBR
Preparation is where most QBRs are won or lost, long before anyone enters the room.
Start by gathering data from Sales, Customer Success, Finance, and Operations. Don't just pull numbers. Turn them into a narrative. What changed this quarter? Why? What does it mean for the next 90 days? That narrative is what your pre-read communicates to attendees before the meeting starts.
Here's a practical preparation sequence:
- Collect KPIs and performance data from each function, comparing actuals against quarterly and annual targets
- Identify exceptions — what's significantly above or below plan, and what's the likely cause
- Draft the pre-read (5–8 pages) focused on strategic narrative, not raw data
- Align with key stakeholders on the story behind the numbers before the full meeting
- Finalize the agenda with time boxes for each phase, and distribute it with the pre-read 48 hours in advance
- Prepare the decision log template so it's ready to fill in real time during the meeting
- Schedule the follow-up monthly pulse check before the QBR even happens, so accountability is built into the calendar
Clean, connected data is the foundation. If your team is still pulling from disconnected spreadsheets and reconciling conflicting forecasts the week before the QBR, the meeting will spend its time on data archaeology instead of decisions. Building a reliable tracking system before QBR season is the preparation that makes every other step easier.
Who owns what in a QBR
Every person in the room has a specific role. When those roles are unclear, the meeting drifts.
The QBR facilitator (typically the CEO or a senior revenue leader) owns the agenda, enforces time boxes, and drives the group toward decisions. This person isn't presenting. They're steering.
Functional leaders (VP of Sales, VP of Marketing, Head of Product, CFO) present their function's performance against shared KPIs, surface risks, and come prepared with recommendations, not just data.
The note-taker maintains the decision log in real time, capturing every commitment with its owner and deadline before it evaporates.
Decision-makers are in the room to make calls, not observe. If someone in the meeting can't make or influence a resource decision, they probably shouldn't be there.
Action item owners leave the meeting with specific, documented commitments. Their accountability is visible to the entire leadership team, which is exactly what makes QBR follow-through different from every other meeting.
For customer-facing QBRs, the roles shift slightly. Your customer success manager leads the session, your executive sponsor provides strategic weight, and the customer's day-to-day users and executive stakeholders both need to be represented. Including senior stakeholders elevates the conversation from tactical updates to long-term partnership planning.
Using data and metrics effectively in QBRs
Data is the raw material of a QBR. How you use it determines whether the meeting produces decisions or just awareness.
The most common mistake is data dumping: presenting every metric, every chart, and every trend without a point of view. Executives don't need more information. They need to understand what the information means and what to do about it.
A few principles that separate effective data use from noise:
Focus on exceptions, not the full scorecard. If a metric is on track, acknowledge it and move on. Spend time on what's off track, why, and what the team proposes to do about it.
Connect metrics to strategic goals. Every KPI you present should tie directly to a quarterly or annual objective. If you can't draw that line, the metric probably doesn't belong in the QBR.
Use a metric tree structure. Rather than department-by-department presentations, organize the conversation around how top-level business outcomes decompose into the operational drivers each function influences. This structure reveals interdependencies that siloed presentations hide.
Validate your data before the meeting. QBRs fail when the underlying tracking system lacks transparency. Inaccurate reporting turns strategic planning into guesswork. If your data is unreliable, fix the source before the meeting, not during it.
Metrics worth tracking in most QBRs include revenue against plan, quota attainment by territory, pipeline health and forecast accuracy, customer retention and churn signals, and initiative progress against milestones. The specific mix depends on your business model, but the principle is the same: every number in the room should answer a question that leadership needs to decide on.
Tools and software that support effective QBRs
The right tools reduce preparation time and improve data quality. Here's what teams typically use across the QBR workflow:
Data aggregation and dashboards. Platforms that connect your CRM, financial systems, and customer success data into a single view eliminate the manual reconciliation that makes QBR prep a week-long ordeal. When data is already connected, the conversation shifts from "what happened" to "what do we do about it."
Strategy and goal-tracking platforms. Tools like ClearPoint Strategy help teams track OKRs and KPIs against strategic plans, generate exception reports automatically, and maintain the decision log between quarterly cycles.
Presentation and collaboration tools. Google Slides, Microsoft PowerPoint, and visual collaboration platforms like Mural support the pre-read and presentation build. The format matters less than the discipline of keeping it to 5–8 pages of narrative, not 40 slides of charts.
Project management tools. Asana, Monday.com, and similar platforms help track action items between QBRs, keeping owners accountable and progress visible without waiting for the next quarterly meeting.
Revenue intelligence platforms. For sales and customer success teams, tools that score customer behavior, flag churn risk, and surface expansion signals give QBR conversations a forward-looking edge. Instead of reacting to last quarter's churn, you're discussing which accounts need attention before they become a problem. Signalengine's churn prediction tools do exactly this, automatically scoring customer signals so your QBR data reflects what's happening right now, not what happened 60 days ago.
The best QBR tech stack isn't the most expensive one. It's the one your team actually uses consistently between meetings, so the data is clean and the decisions are grounded in reality when the quarterly review arrives.
Signalengine gives your QBRs a live data advantage

Most QBR conversations are backward-looking by necessity. Your team spends the week before the meeting reconciling stale data from five different tools, and by the time the deck is ready, half the signals have already shifted. Signalengine changes that equation.
Signalengine's revenue intelligence platform watches your customers continuously, scores their behavior automatically, and flags who's about to leave before they do. That means when you walk into your next QBR, your churn risk data is current, your lead scores reflect actual buying intent, and your team can spend the meeting making decisions instead of debating whether the numbers are accurate.
Starting at $49/month with 31 AI-powered tools built for SMBs, Signalengine is the kind of data foundation that makes every quarterly review sharper, faster, and more honest.
Key Takeaways
Effective QBRs are decision forums, not reporting ceremonies. Teams that treat them as status updates miss the entire point and repeat the same performance gaps quarter after quarter.
| Point | Details |
|---|---|
| QBR core purpose | Diagnose past performance and commit to specific forward actions, not just report what happened. |
| Optimal cadence | Quarterly timing balances data depth with agility; monthly lacks trend insight, semi-annual is too slow to pivot. |
| Pre-read discipline | A 5–8 page pre-read distributed 48 hours in advance shifts the meeting from data review to decision-making. |
| Decision log accountability | 81% of assigned owners never update metrics without visible accountability; the decision log closes that gap. |
| Signalengine advantage | Signalengine scores customer behavior and flags churn risk automatically, giving QBR teams current data instead of stale reports. |
FAQ
What does a quarterly business review actually mean?
A QBR is a structured meeting held every three months to assess performance against objectives, identify gaps, and adjust strategy for the quarter ahead. The key distinction is intent: it interrogates why results happened and commits to what changes next, rather than simply reporting what occurred.
Why are quarterly reviews important for business growth?
Quarterly reviews create the accountability layer that connects annual planning to real performance outcomes. They force honest conversations about what's working, surface cross-functional dependencies, and enable course correction before problems compound across multiple quarters.
How do you conduct a quarterly business review effectively?
Distribute a 5–8 page pre-read 48 hours in advance, invite only decision-makers, time-box the session with the majority of time on decisions rather than status updates, and close every meeting with a decision log that names owners and deadlines. Follow up with monthly pulse checks on the metrics flagged as critical.
What are the most common mistakes to avoid in QBRs?
The biggest mistake is treating QBRs as reporting ceremonies instead of decision forums. Other common pitfalls include covering too many metrics, accepting vague action items with no owners, allowing defensive presentations that hide real issues, and failing to connect QBR outcomes to the next quarter's operating plan.
How does Signalengine support better QBR preparation?
Signalengine automatically scores customer behavior and flags churn risk in real time, so your QBR data reflects current signals rather than data that's weeks old. This means your team spends the meeting deciding what to do, not debating whether the numbers are accurate.
Ready to Stop the Revenue Leak?
Signal Engine gives small and local businesses 31 AI-powered tools to score leads by buying intent, predict churn before it happens, auto-generate email and SMS campaigns, and recover missed calls automatically — all in one dashboard starting at $49/month.
Start your free 7-day trial — no credit card required. Setup takes 5 minutes.