

A good cold email reply rate is somewhere between 1% and 5% for most small businesses, and the spread comes from how the rate is counted, not only from how good the emails are. Strict studies of net-new cold outreach land under 1%. Studies of well-targeted campaigns land at 4% to 5% or higher. Before you compare your number to anyone's average, you need to know which of those worlds you are in.
This guide gives you the 2026 benchmarks, the formula behind them, the ranges by industry and audience, and a simple way to tell whether your own rate is healthy. We built Signal Engine for small service businesses that need to know who is ready to buy, so we care about one thing above the average: reaching the right people with the right message at the right time.
TL;DR
- Average reply rates range from 0.45% to 5.33% depending on the study, the audience and what counts as a reply.
- Always check the denominator. Replies divided by emails sent, delivered or opened can describe the same campaign with numbers ten times apart.
- Positive replies are a fraction of all replies. Expect roughly a quarter or less of replies to be real interest, and about half of those to turn into booked calls.
- Compare yourself to your own audience, not to a global average. Industry and job title move the number more than subject lines do.
- Follow-ups and warm targeting are the biggest levers you control.
Table of Contents
- What counts as a reply?
- The 2026 benchmarks side by side
- Reply rate benchmarks by industry
- Reply, positive reply, meeting: the funnel behind the number
- How follow-ups change your average
- Is your reply rate healthy? A four-step check
- What moves your reply rate the most
- Beyond cold: reply rates for customers you already have
- Put benchmarks to work with Signal Engine
- Our view: stop chasing the average
- FAQ
- Sources
- Ready to Stop the Revenue Leak?
What counts as a reply?
A reply rate is the share of outreach that gets a response. That sounds simple, but three choices change the result.
1. Who counts as a reply. Auto-replies (out-of-office messages) and bounce notifications are not people. One 2026 study of cold campaigns defines reply rate as unique replies divided by emails sent, excluding auto-replies and bounce notices. Another dataset analysis of 6 million emails found that auto-replies roughly matched human replies in volume, which can inflate a published benchmark to about double its real value.
2. The denominator. You can divide replies by emails sent, emails delivered, emails opened, or unique people contacted. Dividing by opens produces a much higher and more flattering number. Dividing by delivered is the fairest everyday baseline, because a bounced email was never seen and could not be answered. A 5% rate against opens and a 0.5% rate against sends can describe the very same campaign.
3. Per email or per person. Say you send a three-email sequence to one person who answers the second email. Per person, that is a 100% reply rate. Per email, it is 33%. Per-person counting stops longer sequences from looking worse than short ones.
So write your own metric out in full, for example: human replies per delivered email, excluding auto-replies. Then keep it fixed every month. A trend in one consistent metric tells you more than any outside average.
The 2026 benchmarks side by side
There is no single correct average. Here is what the largest 2026 datasets show, and why they differ.
| Source and period | Reply rate | What it measures |
|---|---|---|
| NewLead, Jan to Sept 2026 | 5.33% (median client 4.55%) | Real human replies, 1,139,931 emails across 33 client campaigns |
| NewLead's reference point | 3.43% | The widely quoted industry average the study compares itself against |
| Belkins, 2025 campaigns | 0.45% | Unique replies per email sent, strict cold outreach to net-new contacts, 7.5M emails |
| Belkins, US only | 0.51% | 5.6M+ US emails; the UK was 0.48% and Canada 0.63% |
The gap between 0.45% and 5.33% is not a contradiction. The first measures cold outreach to people who have never heard of you, counted against every email sent. The second measures client campaigns counted by real human replies. Neither is wrong. They answer different questions.
A practical reading for a small business in the US: if you email strangers from a purchased or scraped list, plan around 0.5% to 1%. If you email a researched, segmented list of people who fit a clear profile, 3% to 5% is a realistic goal. If you email people who already know you, such as past customers, quotes that went quiet or members who drifted, you are in a different category altogether, and your rate should be well above any cold average.

Reply rate benchmarks by industry
Industry changes the baseline more than almost anything else. Two 2026 datasets show the pattern, and they agree on one point: the range is wide.
In the Belkins study, Food and Beverage reached 3.47%, while construction, financial services, healthcare and legal sat at 0.56% to 0.60%. Banking and insurance were lowest. The study attributes the food and beverage result to lower outreach saturation and decision-makers who respond quickly to supplier messages. Institutional gatekeeping holds banking and insurance down.
NewLead's client-industry breakdown, from a different mix of campaigns, shows property and construction services at 13.49%, SaaS and software at 6.86%, accounting and bookkeeping at 5.51%, consulting and agencies at 4.60%, financial and investment services at 3.73%, and manufacturing at 2.52%.
What should you take from two lists that do not match? Use them as ranges, not targets:
- Local and trade-style services (HVAC, plumbing, landscaping, cleaning) tend to fall in the upper part of these ranges because the owner is usually the buyer and responds directly. Treat that as a reason to test, not a guarantee.
- Regulated or heavily gatekept fields (banking, insurance, healthcare, legal) tend to sit near or below 1%.
- SaaS, agencies and consultants tend to land in the middle, around 4% to 7% in well-targeted campaigns.
Audience and company size
The person you email matters too. In Belkins' data, founders and owners replied at 0.57% versus 0.42% for C-level executives. Companies with 11 to 50 employees replied at 0.49%, against 0.22% for companies with more than 10,000. Small business owners are simply easier to reach than layers of enterprise management, which is good news if you sell to small businesses.
Reply, positive reply, meeting: the funnel behind the number
A reply is not a lead. Many replies are polite refusals, unsubscribe requests or "wrong person" notes. For planning revenue, track the funnel in stages.

A 2026 community report from nasscom analyzing more than 40 million emails across 5,000 campaigns offers a handy rule of thumb: in a well-run campaign, a roughly 10% reply rate becomes about 2.2% positive replies, 1.2% meetings and 0.6% opportunities. About half of positive replies turn into booked meetings.
Here is that funnel turned into a worked example for a small business. You send 500 emails to a well-matched list and get a 4% reply rate:
- 500 emails sent, 20 replies at 4%.
- Applying the same proportion as the nasscom funnel (about a fifth of replies are positive), expect around 4 positive replies.
- About half of those, so 2 calls booked.
Two booked calls from 500 emails is a normal outcome, not a failure. If an average job or customer is worth a few hundred dollars or more, that can pay for the campaign. The point of benchmarking is to know which stage leaks. Plenty of replies but no calls points at your offer or call to action. Few replies at all points at your list or your first line.
How follow-ups change your average
Most replies do not come from the first email. Multiple 2026 benchmark reviews attribute a large share of replies, close to half in some datasets, to follow-up messages rather than the opening email. That is why a campaign measured after one send looks weak and the same campaign measured after a full sequence looks healthy.
When you compare your numbers to a benchmark, check whether the benchmark counted the whole sequence or only the first message. Then use a simple cadence: a short opening email, a brief follow-up that adds one new fact, and a final note that makes it easy to say no. Our follow-up cadence guide lays out ten touch templates for cold leads, and our piece on what automated outreach is explains how to keep sequences consistent without sending every message by hand.
Is your reply rate healthy? A four-step check
Use this routine monthly. It takes less than an hour.
Step 1: Fix your definition. Write it down: human replies, excluding auto-replies and bounces, divided by delivered emails. Pull the three numbers from your email tool. If your tool counts auto-replies, subtract them manually for one month to see the gap.
Step 2: Name your audience tier. Strangers from a list, a researched segment, or known contacts. Each tier has a different healthy range, as shown above. Comparing a past-customer win-back campaign to a cold average hides problems.
Step 3: Compare to the right range. For researched cold lists in the US, 3% to 5% per delivered email is a reasonable target. Strict net-new outreach to senior buyers often sits under 1%. Your own trend over three to six sends matters more than any outside figure.
Step 4: Find the leaking stage. Look at reply rate, positive reply rate and booked calls separately. Fix the stage with the biggest drop first, one change at a time, so you know what worked. For a deeper walkthrough on structuring this kind of outreach, see this guide to SEO outreach strategies for SMBs, which covers how outreach campaigns are planned and measured.
What moves your reply rate the most
Benchmarks are most useful when they tell you what to change. Four levers consistently matter:
- Who you send to. A tight list of people who match your best customers beats a big list every time. This is the one lever you control before writing a word. Our guide on prospecting driven by data shows how small teams build that list without engineers.
- Timing. Reaching someone when they are actually in the market lifts replies. Buying-intent signals, such as repeat visits, a missed call or an expired quote, are better triggers than a calendar. See how buyer intent scoring turns those signals into an outreach trigger.
- Relevance in the first line. One specific, true detail about the recipient's business does more than any subject-line trick.
- Follow-ups. Covered above. A sequence nearly always beats a single send.
If you run an agency, the same logic applies to your clients' campaigns. Our walkthrough of automating prospect outreach for agencies covers the steps.
Beyond cold: reply rates for customers you already have
Most small service businesses, including HVAC, dental, salons, auto repair, cleaning and churches, earn more from people who already know them than from strangers. Outreach to existing customers, lapsed clients or drifting members is warm, and its reply rates should be judged against your own history, not against cold averages. Renewal reminders, rebooking nudges and check-ins are the usual examples. For SaaS teams, our renewal rate improvement workflow and churn intervention outreach guide apply the same measurement to retention. Retention teams also get value from email automation in retention.
Put benchmarks to work with Signal Engine
A benchmark tells you where you stand. Acting on it means knowing who to contact and when, then getting the message out without burning your week. Signal Engine scores every customer on buy-readiness, flags who is about to churn, and drafts the next action, holding it for one-click approval before anything reaches a real customer. It is built for small service businesses, with 17 industries ready out of the box and an onboarding AI that builds a custom mode for businesses that do not fit.
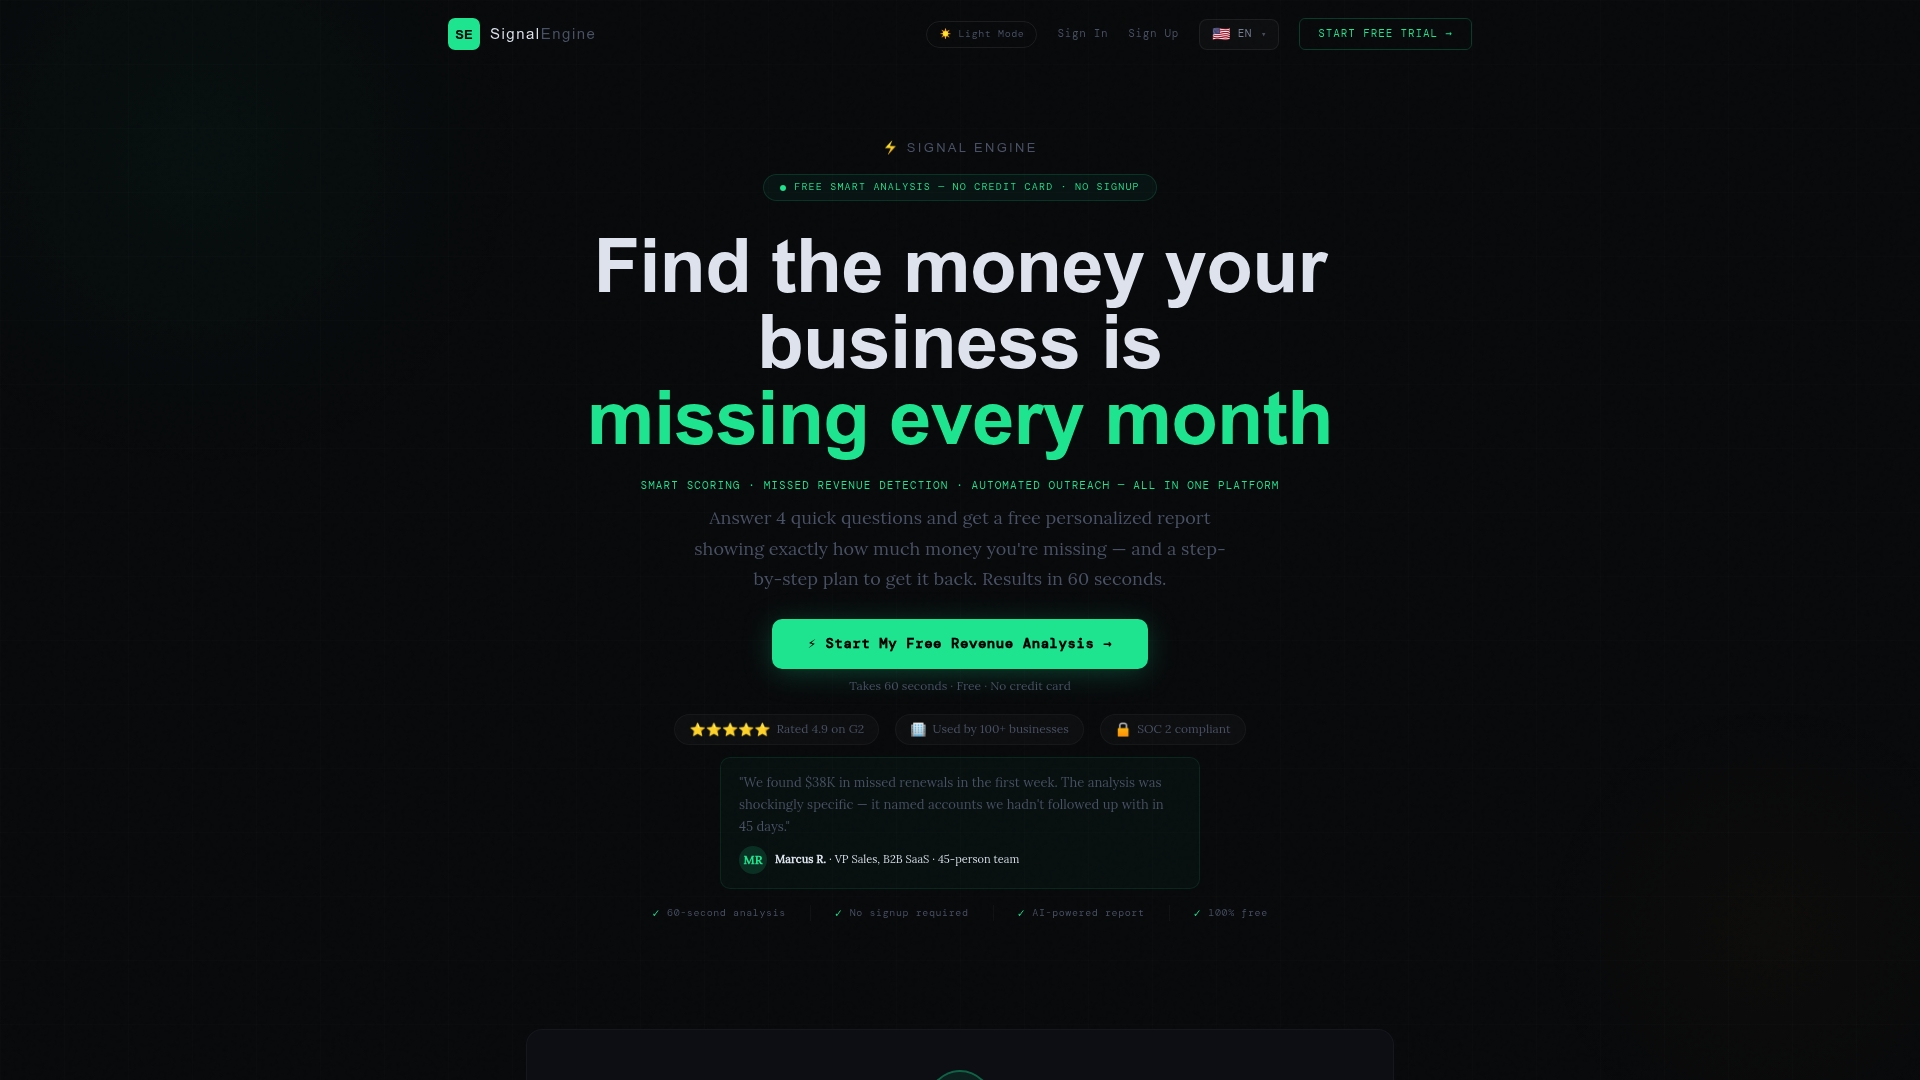
The Growth plan is $149 per month and the Scale plan is $297 per month, and there is a Free plan too. Our approach is that all features are included in every plan, with no per-seat pricing. See plans and pricing, or explore lead scoring for small business to see how buy-readiness scoring sharpens your list before you send a single email.
Our view: stop chasing the average
Every week someone asks us what a good reply rate is. We understand why. A number feels like safety.
Here is how we think about it. The average hides the thing that matters: who you sent to and when. Two businesses can send the same email. One sends it to a cold list and gets under 1%. The other sends it to the customers whose signals say they are ready and gets several times that. The email did not change. The targeting did.
That is why we built Signal Engine around scoring, not blasting. Our platform scores every customer on buy-readiness, flags churn risk early and drafts the next action for you to approve with one click. Your message goes to the people most likely to answer, at the moment they are most likely to answer.
Define your metric, pick the right benchmark tier, then spend your effort on list quality, timing and follow-ups. That is where reply rates actually move.
Bernard
FAQ
What is a good reply rate for cold email?
For a researched, segmented list, 3% to 5% per delivered email is a healthy target, and 7% or more is strong. For strict outreach to net-new senior contacts, studies such as Belkins' 2026 report show rates around 0.45% to 0.51%. Judge yourself against the tier that matches your audience.
What is the average response rate for email outreach?
There is no single figure. Reported averages in 2026 run from 0.45% for strict cold outreach to 5.33% for real human replies in NewLead's client campaigns. The gap comes from the audience, what counts as a reply and what the rate is divided by.
Should I count auto-replies as replies?
No. Out-of-office messages and bounce notices are not people responding to your offer. Count human replies only and divide by delivered emails. Keep that definition constant so month-to-month changes mean something.
How many replies turn into customers?
In a well-run campaign, a 10% reply rate becomes roughly 2.2% positive replies, 1.2% meetings and 0.6% opportunities, with about half of positive replies booking a meeting. Track each stage so you can see exactly where interest drops off.
Sources
- NewLead: Cold email benchmarks by industry and market, 2026
- Belkins: B2B cold email response rates, 2026 study
- nasscom community: Cold email outreach stats for 2026
Ready to Stop the Revenue Leak?
Signal Engine gives small and local businesses 31 AI-powered tools to score leads by buying intent, predict churn before it happens, auto-generate email and SMS campaigns, and recover missed calls automatically — all in one dashboard starting at $49/month.
Start your free 7-day trial — no credit card required. Setup takes 5 minutes.